
A reproducible, high-throughput platform to quantitatively study AAVs
Cell & Gene Therapy Insights 2020; 6(3), 449–453
10.18609/cgti.2020.055
The adeno-associated virus (AAV) has the potential for major therapeutic advances in the future due to its low immunogenic response in humans. Studying AAVs through sodium dodecyl sulfate-polyacrylamide gel (SDS-PAGE) electrophoresis presents multiple challenges in user variability and time consumption. In order to resolve these challenges, a microfluidic platform, the LabChip® GXII Touch™ system, was used to characterize AAV serotype 8 (AAV8) particles. This reproducible technology can be used for high-throughput, quantitative characterization of AAV particles.
Adeno-associated virus may play a major role for gene therapy applications in the near future. This is due to their ability to infect dividing and quiescent cells while only causing a mild immune response in hu-mans. These small viruses, when engineered to carry specific genes, can be a powerful tool in fighting many diseases. In order to achieve this, AAVs must be well characterized and studied.
Typically, AAVs are studied using SDS-PAGE gels with silver stain. This highly sensitive method yields con-vincing qualitative results but is time consuming and user dependent. Studying AAVs through SDS-PAGE with silver stain in a high-throughput manner is a difficult task [1, 2]. This article will specifically look at a microfluidic electrophoresis-SDS platform as a potential solution to simplify the quantitative study of AAVs.
µCE-SDS uses electric fields to create a migration difference based on the charge of the analytes. The ana-lytes are then exposed to fluorescent light to measure the amount of each in the sample. This process is highly reproducible and has comparable sensitivity to SDS-PAGE with silver stain [2, 3]. µCE-SDS platforms, such as the LabChip® GXII Touch™ system, have the potential to quantitatively study AAVs in a consistent manner.
The LabChip® GXII Touch™ system is a reproducible quantitative instrument to characterize analytes. This system has a highly sensitive standardized analysis for the size, concentration and purity of proteins. Run-ning 150 nl samples in under 65 s, this automated system is 21 CFR 11 GMP compliant. In this article, we show how AAV8 was characterized using the LabChip® GXII Touch™ system.
AAV8 Characterization
AAV8 particles (catalog#A81000, Welgen Inc., Worcester MA) were generated from HEK-293 cells and contained at least 5×10¹² genome copies (GC)/ml. This material was placed in a hardshell 96 well V-bottom SBS plate (catalog #6008870, PerkinElmer, Waltham MA) along with the ProteinEXact™ assay’s nonreducing sample buffer. The plate was sealed and heated at 70oC for 10 minutes. Once cooled to room temperature, Milli-Q® water (Millipore, Bedford MA) was mixed into each well. The plate was then analyzed on the LabChip® GXII Touch™ system once the plate was spun at 1200 RCF to remove any bubbles.
The AAV capsid forms an outer shell with three viral proteins (VP) known as VP1, VP2, and VP3. These proteins not only protect the AAV genome, but also perform host cell binding. The denatured AAV8 cap-sid proteins were measured using the ProteinEXact™ Assay on the LabChip® GXII Touch™ system. The resulting electropherogram is shown in Figure 1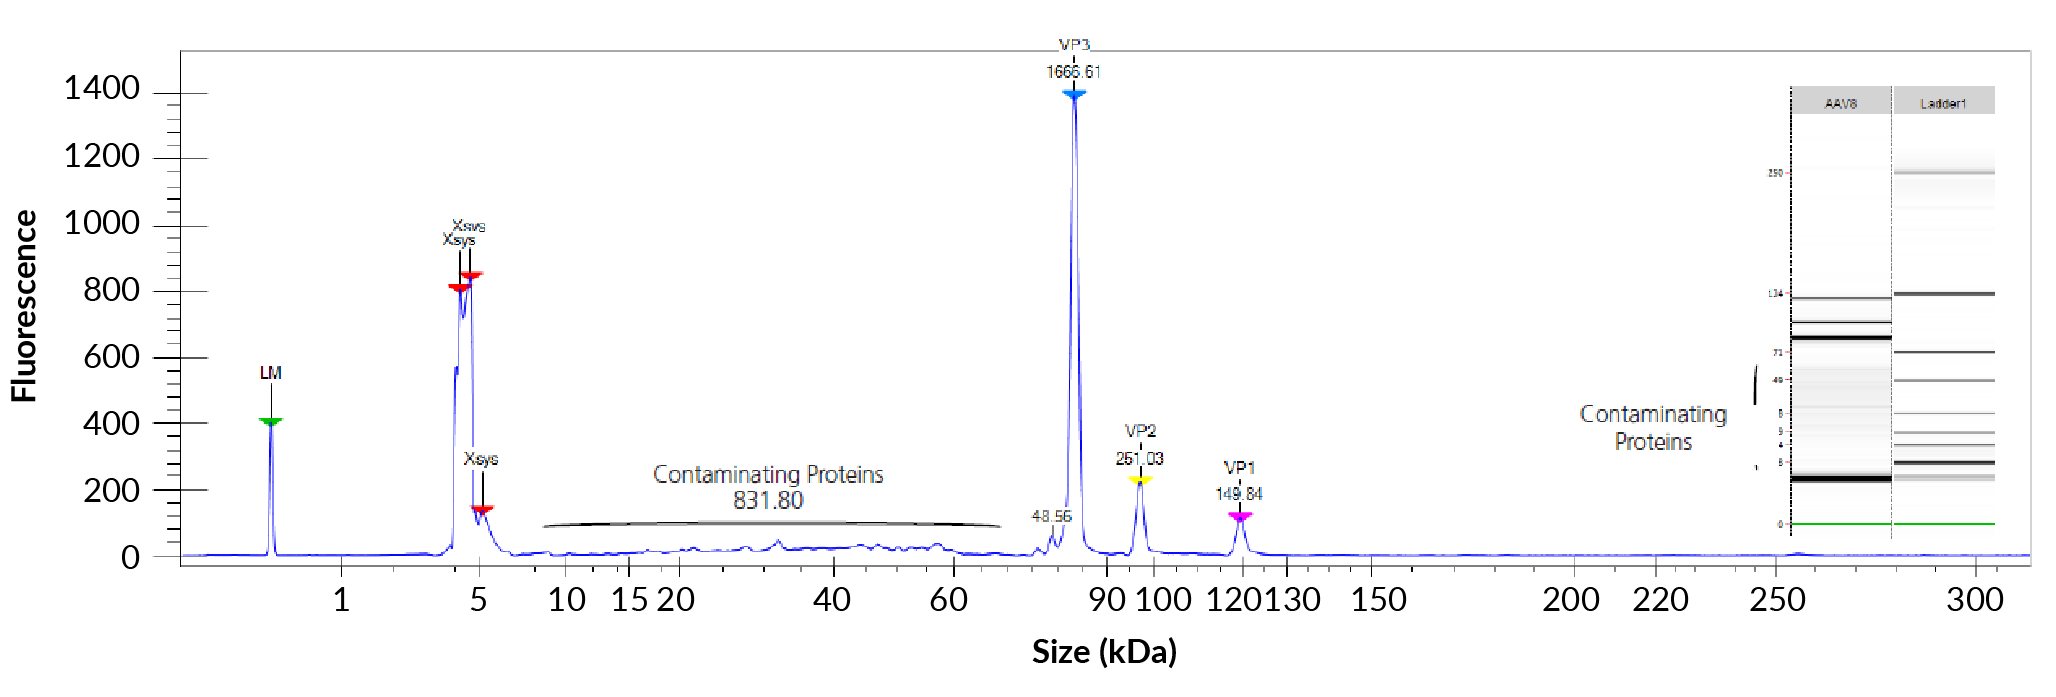
The AAV8 VP ratios were determined through automatic calculation of the corrected area under the curve (AOC) by the LabChip® Reviewer software. To demonstrate the reproducibility in this determination, 12 samples were superimposed and compared (Figure 2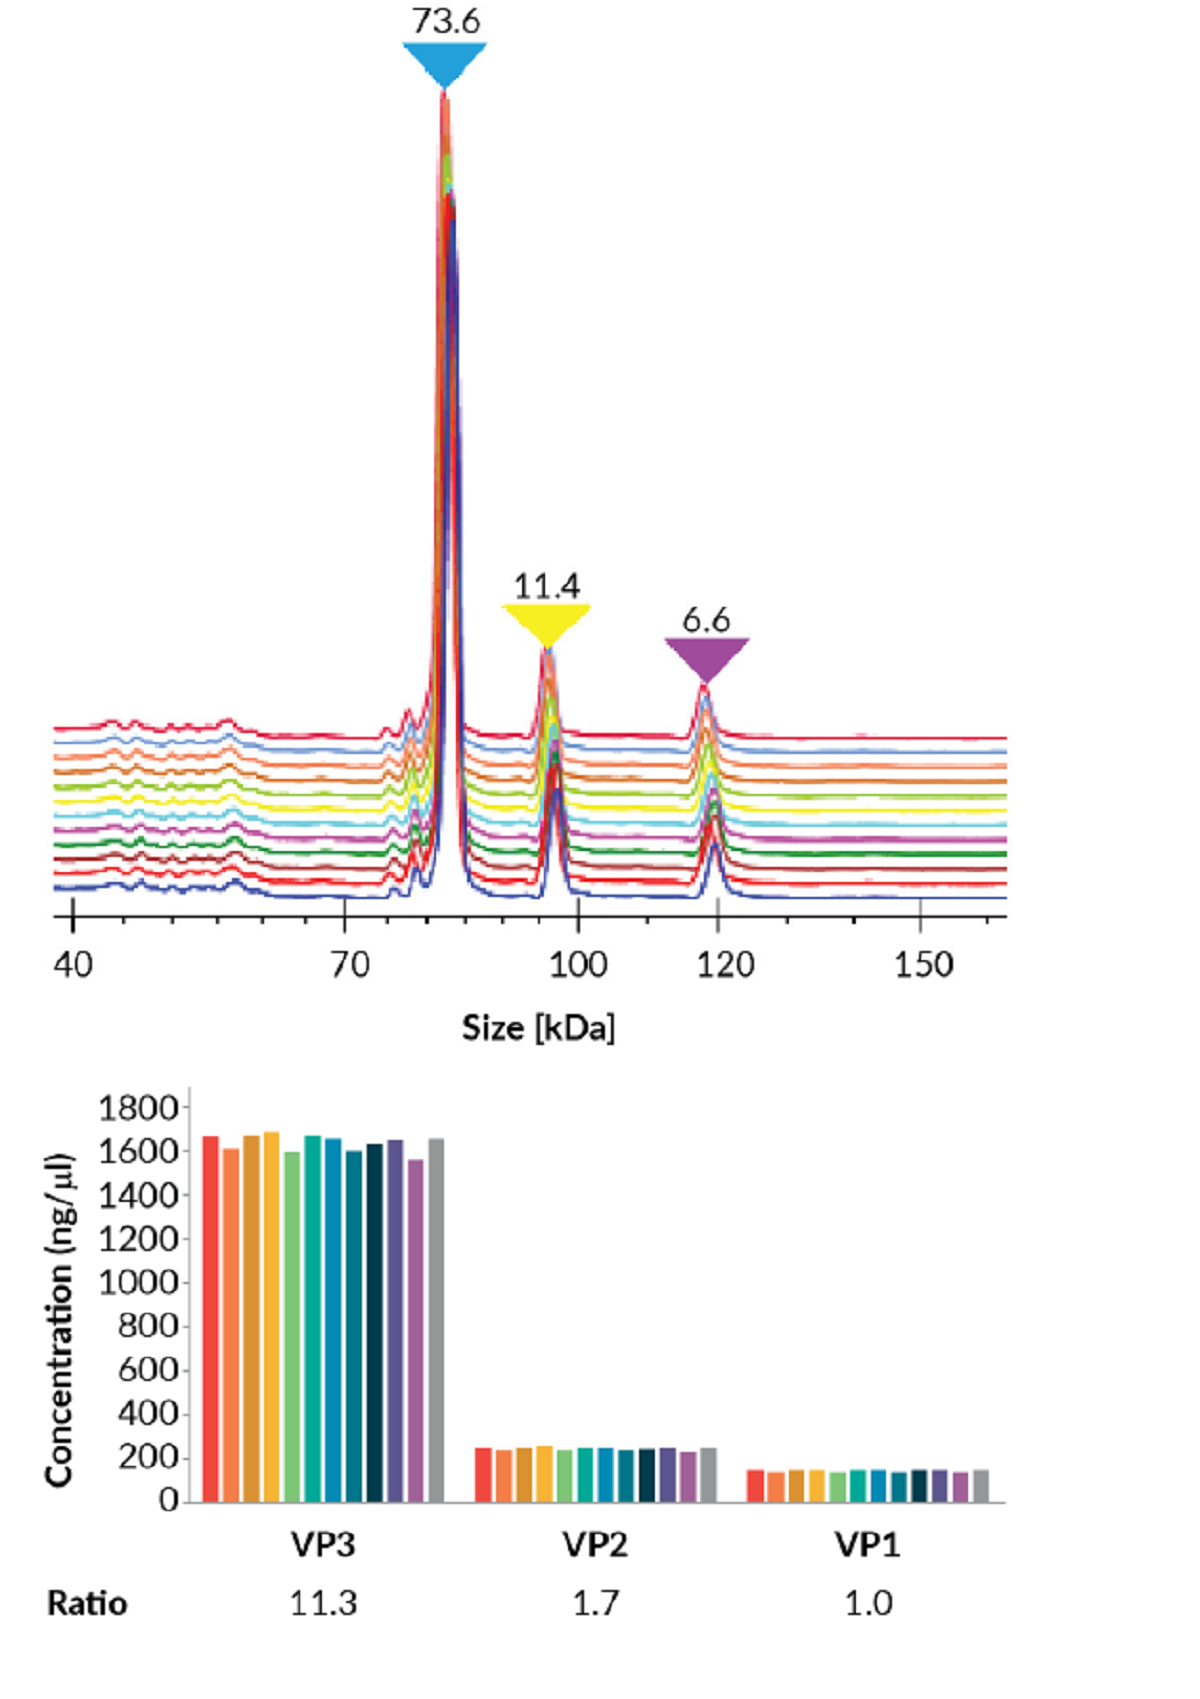
This AAV capsid ratio profile can be further used to distinguish AAV serotypes. Purified AAV serotypes were run through the LabChip® GXII Touch™ system and the peaks were determined (Figure 3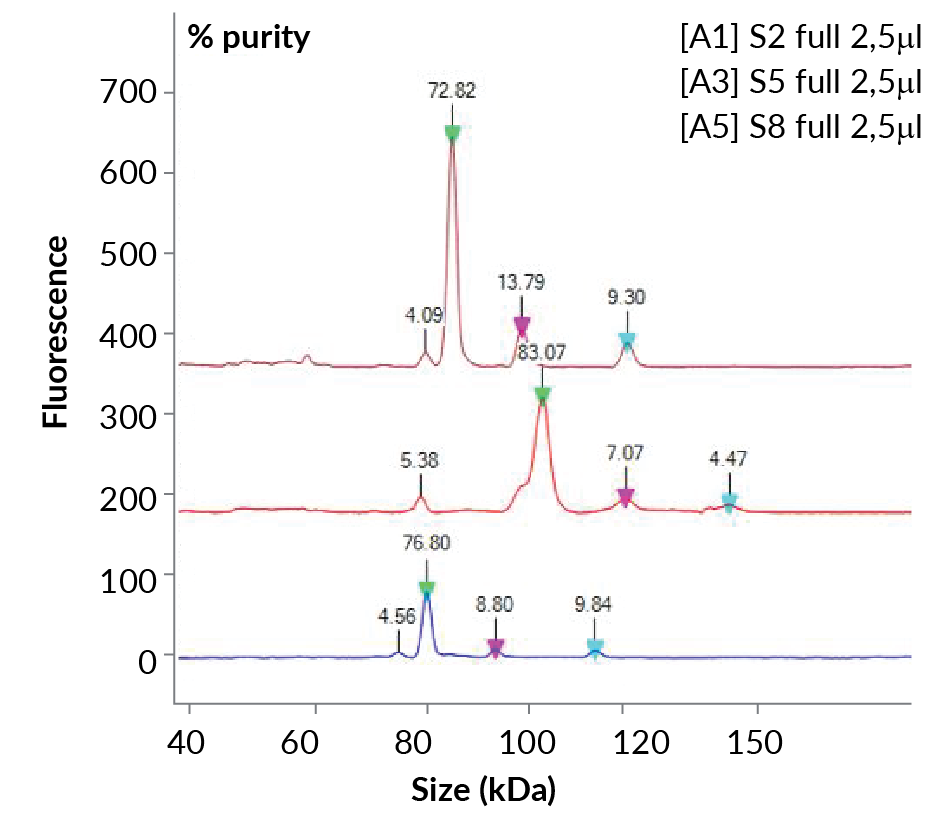
The LabChip® GXII Touch™ system is an efficient, accurate and reproducible µCE-SDS alternative to SDS-PAGE with silver stain for the quantitation of proteins. This system yields high-quality quantitative results with a faster analysis time and increased throughput than SDS-PAGE with silver stain4. The LabChip® GXII Touch™ system supports high-throughput AAV research by standardizing the analysis of the size, concentration and purity of proteins.
For research use only. Not for use in diagnostic procedures.
Authorship & Conflict of Interest
Contributions: All named authors take responsibility for the integrity of the work as a whole, and have given their approval for this version to be published.
Acknowledgements: None.
Disclosure and potential conflicts of interest: The authors declare that they have no conflicts of interest.
Funding declaration: The authors received no financial support for the research, authorship and/or publication of this article.
Article & copyright information
Copyright: Published by Cell and Gene Therapy Insights under Creative Commons License Deed CC BY NC ND 4.0 which allows anyone to copy, distribute, and transmit the article provided it is properly attributed in the manner specified below. No commercial use without permission.
Attribution: Copyright © 2020 PerkinElmer Corp. Published by Cell and Gene Therapy Insights under Creative Commons License Deed CC BY NC ND 4.0.
Article source: Invited; externally peer reviewed..
Submitted for peer review: Mar 4 2020 Revised manuscript received: Apr 6 2020.Publication date: Apr 28 2020.
References
1. Zhu Z, Lu JJ, Liu S. Protein Separation by Capillary Gel Electrophoresis: a Review. Anal. Chim. Acta 2012; 709: 21–31. CrossRef
2. Hsieh J-F, Chen S-T. “Comparative Studies on the Analysis of Glycoproteins and Lipopolysaccharides by the Gel-Based Microchip and SDS-PAGE. Biomicrofuidics 2007; 1(1): 014102. CrossRef
3. Vasilyeva Elena, Woodard J, Taylor FR et al. Development of a Chip‐Based Capillary Gel Electrophoresis Method for Quantification of a Half‐Antibody in Immunoglobulin G4 Samples. Electrophoresis 2004; 25: 21–2. CrossRef
4. PerkinElmer. ProteinEXact™ HR Assay User Guide For LabChip® GXII Touch: Document
Affiliations
James White and Natalia Rodionova
PerkinElmer, USA
![]()