Enrichment of full rAAV capsids in a scalable, reproducible viral vector manufacturing platform
Cell & Gene Therapy Insights 2021; 7(11), 1563–1579
10.18609/cgti.2021.211
Recombinant adeno-associated viruses (rAAV) are the gene transfer vector of choice for many in vivo gene therapies. These vectors are synthetic viral particles which can deliver a therapeutic gene to a patient or patients’ cells to correct a genetic abnormality. These viral vectors can be produced in single-use bioreactors and purified using scalable single-use technologies. We evaluated the use of scalable, single-use filtration and chromatography technologies for downstream purification of an rAAV5 viral vector. In this testing, vector was produced in the Pall iCELLis® Nano bioreactor by polyethylenimine (PEI) mediated triple-plasmid transfection. The harvest material was clarified using direct flow filtration with a combination of Seitz-P grade depth and 0.2 mm sterilizing grade filters. The product was concentrated using 100 kDa OmegaTM Membrane flat-sheet tangential flow-filtration (TFF) before primary purification with affinity chromatography. Affinity purified vector was polished using Mustang® Q membrane chromatography to enrich for full capsids. The rAAV5 product was then concentrated and diafiltered to the final formulation using 100 kDa Omega TFF membrane. The final product was sterile filtered using Pall’s Supor® EKV validated sterilizing-grade filters. This manufacturing process was optimized and evaluated for vector yield, low contaminant profile and full capsid enrichment. We established feasibility of a near complete end-to-end manufacturing process using almost all materials available from Pall Corporation. This process resulted in a theoretical whole process yield of ~25% with a low contaminant profile (host cell protein [HCP] and [DNA]) and a ~5-fold enrichment of full capsids to total capsids. The purification process described here shows potential for a scalable, platformable process for rAAV products.
Recombinantly produced adeno-associated viruses (rAAV) are now the predominant vector for in vivo gene therapies. These synthetic viruses can deliver a functional gene to correct a genetic defect and/or inhibit the cell from producing a defective version of the gene to restore normal function [1]Ayuso E. Manufacturing of recombinant adeno-associated viral vectors: new technologies are welcome. Mol. Ther. Methods Clin. Dev. 2016; 3: 15049.Ayuso E. Manufacturing of recombinant adeno-associated viral vectors: new technologies are welcome. Mol. Ther. Methods Clin. Dev. 2016; 3: 15049..
These medicines are a new class of biologics with the US FDA’s first approval of an in vivo gene therapy in 2017. This viral vector was Spark Therapeutic’s Luxturna® which is a treatment for biallelic RPE65 mutation-associated retinal dystrophy [2]FDA approves novel gene therapy to treat patients with a rare form of inherited vision loss. FDA, released December 18, 2017. . Subsequently, the US FDA approved Novartis’ Zolgensma® for spinal muscle atrophy (SMA) [3]FDA approves innovative gene therapy to treat pediatric patients with spinal muscular atrophy, a rare disease and leading genetic cause of infant mortality. FDA, released May 24, 2019. . These treatments are literally lifesaving and can bring sight to the blind [4]Mendell JR, Al-Zaidy SA, Rodino-Klapac LR et al. Current Clinical Applications of In Vivo Gene Therapy with AAVs. Mol. Ther. 2021; 29(2): 464–88. .
One of the biggest challenges in bringing these life-changing treatments to patients is their production. For products such as Luxturna where the disease indication is rare and the vector amount per dose is low (∼1.5 x 10¹¹ viral genomes per eye), there is a relatively low manufacturing burden. For more prevalent indications that require systemic administration with a high vector dose (>1 x 10¹⁴ vg/kg), such as Duchene’s muscle dystrophy (DMD), manufacturing becomes a significant bottleneck [1]Ayuso E. Manufacturing of recombinant adeno-associated viral vectors: new technologies are welcome. Mol. Ther. Methods Clin. Dev. 2016; 3: 15049.Ayuso E. Manufacturing of recombinant adeno-associated viral vectors: new technologies are welcome. Mol. Ther. Methods Clin. Dev. 2016; 3: 15049.. Other viral vectors are in development such as Uniqure’s AMT-061 (entranacogene dezaparvovec), a gene therapy treatment currently in clinical trials for Hemophilia B. This vector is based on adeno-associated virus serotype 5 (rAAV5) and utilizes a more moderate dose of 2 x 10¹³ vg/kg and has a moderate manufacturing burden [5]Von Drygalski A, Giermasz A, Castaman G et al. Etranacogene dezaparvovec (AMT-061 phase 2b): normal/near normal FIX activity and bleed cessation in hemophilia B. Blood Adv. 2019; 3(21): 3241–7. .
Typical rAAV purification methods used in academic research are generally small scale and utilize ultracentrifugation for purification. This purification method results in very high purity product; however, these methodologies are not scalable [6]Wang D, Tai PWL, Gao G. Adeno-associated virus vector as a platform for gene therapy delivery. Nat. Rev. Drug Discov. 2019; 18: 358–78..
The biopharmaceutical industry has decades of experience producing biologics such as recombinant proteins, predominately monoclonal antibodies, at industrial scale. These molecules are produced in single-use or stainless-steel bioreactors with batch sizes up to 20,000 L. The purification strategies for these moieties rely on technologies with scalable performance including depth and sterile filtration, affinity and ion-exchange chromatography and tangential flow filtration (TFF). These technologies are platformed into a common industrial strategy for the purification of monoclonal antibodies, via the following process steps: clarification by direct flow filtration (combination of depth, bioburden reduction, and sterile), affinity chromatography, ion-exchange chromatography polishing, concentration and diafiltration to final formulation using TFF and finally sterile filtration [7]Kelley B. Very large scale monoclonal antibody purification: the case for conventional unit operations. Biotechnol. Prog. 2007; 23(5): 995–1008. , [8]Shukla AA, Hubbard B, Tressel T, Guhan S, Low D. Downstream processing of monoclonal antibodies--application of platform approaches. J. Chromatogr. B Analyt. Technol. Biomed. Life Sci. 2007; 848(1): 28–39. .
Here we evaluated the feasibility of applying a similar platform approach using many of the tools applied to mAb purification, for purification of a rAAV5 viral vector. The process was evaluated for product yield, purity and full capsid enrichment. In addition, specific unit operations were evaluated for process robustness.
Materials & methods
rAAV5 Production in iCELLis® Fixed-bed Bioreactor
HEK293-T cells (ATCC) were recovered from cryopreservation and maintained in exponential growth using Dulbecco’s Modified Eagle’s Medium (DMEM, Thermo) supplemented with 10% fetal bovine serum (FBS, Thermo), 4 mM GlutaMax™ (Thermo) and 1X non-essential amino acids (NEAA, Thermo). Seed train biomass was propagated in T-flask and CellSTACK® (Corning) multi-layer trays.
Cell growth in the iCELLis® Nano bioreactor was monitored until the cell density reached ∼150,000 cells/cm2 at which point transient transfection was performed. The culture was continued for 5 days. The spent media was collected and treated with 25 U/mL Benzonase® (EMD Millipore) and 2 mM MgCl2 for 1 hour at 37°C. The cells contained within the fixed bed were lysed with 10 mM tris-HCl, 2 mM MgCl2, 1% Tween 20, and 25 U/mL Benzonase, pH 8.0 at room temperature overnight. After recovery of the lysate, the fixed bed was rinsed with 1 system volume of PBS. All harvest materials were brought up to a 500 mM total NaCl concentration. The final harvest material was a pool of the cell lysate, spent media and PBS rinse.
Clarification
Clarification of the harvest pool was performed using Seitz® P-grade PDK11 depth filters in series with Supor® EKV sterile filters. These are dual-layer cellulose depth filters (2–20 mm retention) and dual-layer polyethersulfone filters (PES, 0.65/0.2 mm), respectively. Depth filter work was undertaken in Supracap™ 50 capsules (22 cm2) or 5” or 10” Supracap 100 capsules (0.025 and 0.05 m2). Sterile filter work was undertaken in Mini Kleenpak™ Syringe filters (2.8 cm2), Mini Kleenpak™ 20 capsules (20 cm2) or Mini Kleenpak™ capsules (220 cm2). In all cases capsule size was chosen based on the volumetric loading target. Prior to the clarification step operation, the filters were flushed with 20 L/m2 of 1X PBS after which, the upstream holdup volume was drained from both filters. Turbidity of the crude harvest and clarified pools were measured by a Hach® 2100Q portable turbidimeter. Flux rates of 100 or 200 L/m2/hr (LMH) were used on the depth filters, and 200-250 LMH on the sterile filters. Following loading, the filter trains were flushed with 1.5X holdup volumes with 1X PBS buffer.
Concentration
Pall Omega™ 100 kDa single-use TFF cassettes were used to concentrate the clarified pool. T01 (0.01 m2) and T02 (0.02 m2) cassettes were stacked in various combinations based on the volumetric loading target. Prior to use, the cassettes were flushed with water and equilibrated with 1X PBS buffer in accordance with their care and use procedures [9]Cadence™ Single-Use Tangential Flow Filtration (TFF) Modules with Omega Membrane, Pall Corporation, Instructions for use USD 2896.Cadence™ Single-Use Tangential Flow Filtration (TFF) Modules with Omega Membrane, Pall Corporation, Instructions for use USD 2896., [10]T-Series TFF Cassettes with Omega™ Membrane Care and Use Procedures, Pall Corporation, Biotech User Guide, USTR 2433b.T-Series TFF Cassettes with Omega™ Membrane Care and Use Procedures, Pall Corporation, Biotech User Guide, USTR 2433b.. For the flux excursion work, the system was setup in full recycle and loaded with a clarified rAAV5 pool. An initial check showed stable flux over time for set crossflow and transmembrane pressure (TMP) conditions, indicating there was no significant fouling from the feed stream. For each crossflow condition the TMP was ramped up until the permeate flux levelled off. Membranes were depolarized between crossflow conditions by recirculating with the retentate valve open and permeate valve closed for >10 min.
Six concentration studies were performed with filters loaded between 178 and 206 L/m2. A 10X volumetric concentration factor was targeted for each trial. Following concentration, the membrane was depolarized by recirculating with the retentate valve open and permeate valve closed for >10 min. The system was then drained into the retentate vessel. A 25 mL flush of 1X PBS (equivalent to ∼1.5X holdup volumes) was added to the system, recirculated for 10 min with permeate closed, and drained. The recovery flush and concentrated pool were finally combined and filtered through a Supor® EKV sterilizing-grade filter.
Affinity chromatography
Post-TFF, rAAV5 harvest was loaded onto a Thermo Scientific™ POROS™ GoPure™ AAVX Pre-packed Column, 0.8 x 10 cm, 5 mL. Affinity chromatography was performed on AKTATM Avant system (Cytiva). To compensate for long loading times and mitigate pool instability from the recommended 3-minute residence time, the post-TFF pool was split into two fractions and loaded onto two columns (~400–600 mL/column). Columns were equilibrated with 50 mM Tris, 0.5M NaCl, pH 7.5. Wash buffer was the same as equilibration buffer. Elution buffer was 50 mM Citric Acid, pH 2.0. 1 mL of 1M Tris pH 8.5 per 5 mL of eluate was added to the collection tube for instant neutralization. The generic Thermo Scientific conditions for elution pH were modified to pH 2 instead of 3.
Membrane chromatography polishing
Post-affinity rAAV5 was diluted to ~1L with 20 mM Bis-tris propane (BTP) buffer at pH 9. Mustang Q chromatography was performed on AKTATM Avant. After equilibrating the column, the diluted sample was loaded at 50 mL/min (10 MV/min) onto 5 mL Mustang® Q capsules, followed by wash with the equilibration buffer. The sample was eluted using a conductivity step gradient aiming for ~1 mS/cm increase per step, achieved by varying the percent amount of equilibration buffer to elution buffer (Table 1).
| Table 1 The chromatography method used for rAAV5 full capsid enrichment. | ||
| Step | Buffers used/details | Membrane volumes used |
| 0 – Priming of membrane | Equilibration (10 mL/min – upflow) Equilibration (10 mL/min – downflow) Conditioning (25 mL/min – downflow) Strip (25 mL/min – downflow) Equilibration (50 mL/min – downflow) | 10 per step |
| 1 – Equilibration of membrane | Equilibration buffer | 20 |
| 2 – Application of sample | rAAV5 sample solution | N/A – Inject all sample using air sensor |
| 3 – Washing of membrane | Equilibration buffer | 10 |
| 4 – Step gradients | Buffer A – Equilibration buffer Buffer B – Elution buffer Step 1 = 10% Buffer B, 90% Buffer A Step 2 = 15% Buffer B, 85% Buffer A Step 3 = 20% Buffer B, 80% Buffer A Step 4 = 25% Buffer B, 75% Buffer A Step 5 = 30% Buffer B, 70% Buffer A Step 6 = 35% Buffer B, 65% Buffer A Step 7 = 40% Buffer B, 60% Buffer A Step 8 = 45% Buffer B, 55% Buffer A Step 9 = 50% Buffer B, 50% Buffer A Step 10 = 55% Buffer B, 45% Buffer A Step 11 = 60% Buffer B, 40% Buffer A Step 12 = 65% Buffer B, 35% Buffer A Step 13 = 70% Buffer B, 30% Buffer A Step 14 = 75% Buffer B, 25% Buffer A Step 15 = 80% Buffer B, 20% Buffer A Step 16 = 85% Buffer B, 15% Buffer A Step 17 = 90% Buffer B, 10% Buffer A Step 18 = 95% Buffer B, 5% Buffer A Step 19 = 100% Buffer B, 0% Buffer A | 10 per step |
| 5 – Strip | 20 mM BTP, pH 9, 1M NaCl | 10 |
Formulation
Pall Omega™ 100 kDa single-use TFF cassettes were used to concentrate and diafilter the purified pool into formulation buffer. Prior to use, the cassettes were flushed with water and equilibrated with buffer in accordance with their care and use procedures [9]Cadence™ Single-Use Tangential Flow Filtration (TFF) Modules with Omega Membrane, Pall Corporation, Instructions for use USD 2896.Cadence™ Single-Use Tangential Flow Filtration (TFF) Modules with Omega Membrane, Pall Corporation, Instructions for use USD 2896., [10]T-Series TFF Cassettes with Omega™ Membrane Care and Use Procedures, Pall Corporation, Biotech User Guide, USTR 2433b.T-Series TFF Cassettes with Omega™ Membrane Care and Use Procedures, Pall Corporation, Biotech User Guide, USTR 2433b.. The Mustang® Q elution pool was first concentrated to a target volumetric concentration factor of 10X, or until the retentate pool volume dropped to the TFF system holdup volume. The pool was then exchanged with seven diavolumes of 20 mM Tris (pH 8.0), 1 mM MgCl2, 200 mM NaCl, 0.005% Pluronic F68 [11]Zolgensma (onasemnogene abeparvovec-xioi)[package insert] – Novartis Bannockburn, IL (2019).. A crossflow rate of 7.5 L/m2/min (LMM) and TMP of 15 psi was used for the concentration and diafiltration. For recovery the membrane was depolarized by recirculating with the retentate valve open and permeate valve closed for >10 min. The system was then drained into the retentate vessel. A 1.5X holdup volume flush of formulation buffer was added to the system, recirculated for 10 min with permeate closed, and drained. The recovery flush and concentrated pool were then combined before final filtration.
Sterile filtration
A Supor® EKV 0.65 / 0.2 µm sterilizing-grade filter was used for final filtration. The filtration was done using Mini Kleenpak™ Syringe capsules (2.8 cm2) in constant flow mode with a flux target of 500 LMH. Feed and filtrate pools were analyzed for rAAV5 concentration to calculate virus transmission.
Analytical methods
In-process samples were collected and stored at -80 °C.
Viral vector physical titer was measured using droplet digital polymerase chain reaction (ddPCR) assay using the Bio-Rad QX200 AutoDG Droplet Digital PCR System. The PCR primer/probe (IDT) combination targeted an amplicon contained in the gene of interest of the rAAV transfer genome.
rAAV5 Capsid titer was measured using a commercially available AAV5 capsid ELISA (Progen). Host cell protein concentration was measured using a commercially available ELISA kit (Cygnus). dsDNA concentration was measured with Quant-It™ Picogreen™ Assay kit (Thermo).
SDS-PAGE was performed on a 10% Criterion™ XT Bis-Tris gel for 60 minutes at 150V. The gel was then stained using SyproTM Ruby fluorescent stain and imaged on a Bio-Rad ChemiDoc.
Results
Clarification
rAAV5 was produced in the iCELLis® Nano bioreactor as described in the methods section. Approximately ~60% of the rAAV5 virus is retained by the cells and ~40% secreted into the production media (data not shown). Functional rAAV vector is reported to be found both retained by cells and in the spend cell culture medium [12]Vandenberghe LH, Xiao R, Lock M, Lin J, Korn M, Wilson JM. Efficient serotype-dependent release of functional vector into the culture medium during adeno-associated virus manufacturing. Hum. Gene Ther. 2010; 21(10): 1251–7. . The crude harvest pool consisted of the fixed-bed lysate, spent media and a phosphate buffered saline (PBS) bioreactor rinse.
Multiple combinations of depth and sterilizing-grade filters were screened to evaluate clarification performance. The screening results showed the combination of Pall’s P-grade PDK11 depth filter in series with a Supor® EKV sterilizing-grade filter resulted in the highest performance based on capacity, impurity reduction, and yield (data not shown).
The PDK11/EKV filter train was evaluated for robustness over the course of eight bioreactor harvests. The average titer of the crude harvest material was 7.82 x 10⁹ gc/mL +/- 1.17 x 10⁹. The turbidity of the crude harvest material ranged from 11 to 129 nephelometric turbidity units (NTU). A summary of the clarification performance is found in Table 2.
The data in Table 2 shows the filter train was able to consistently reduce the crude harvest turbidity down to less than 5 NTU with no significant product loss. Furthermore, we saw strong process robustness against feedstream turbidity with regards to clarified pool turbidity and step yield. A summary of the turbidity reduction is shown in Figure 1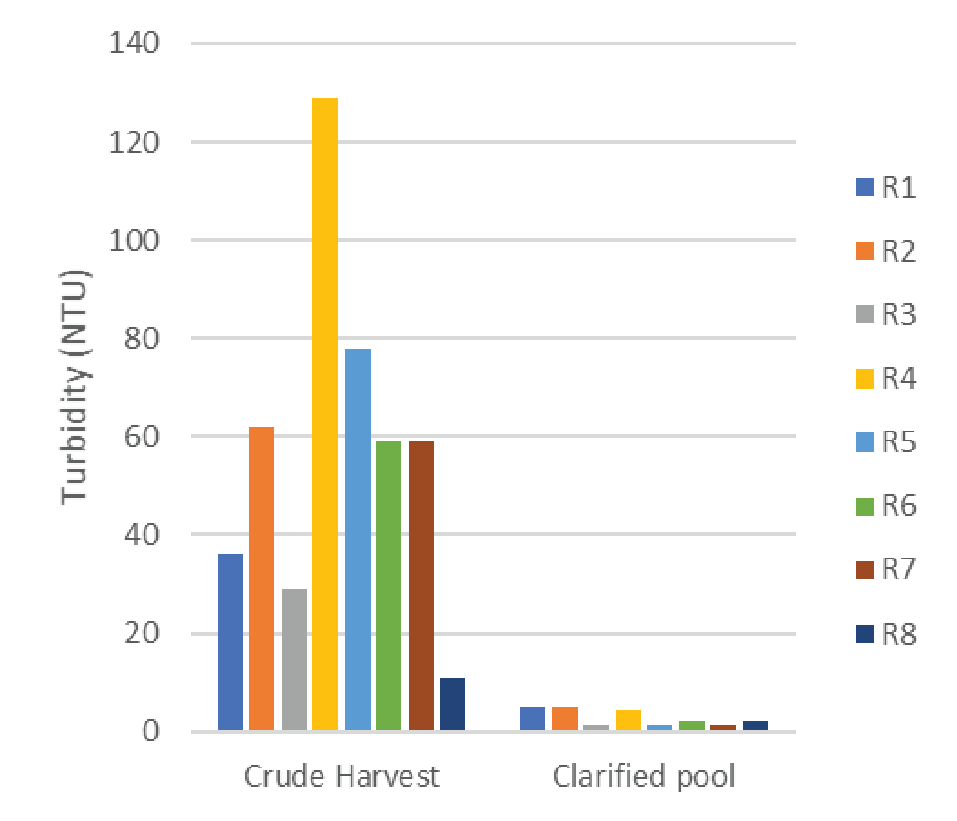
| Table 2 rAAV5 clarification performance summary. | |||
| Attribute | Data points | Average | 95% confidence interval |
| Feed turbidity | n=8 | 57.9 NTU | 24.8 NTU |
| Pool turbidity | n=8 | 2.9 NTU | 1.1 NTU |
| Yield (ddPCR) | n=8 | 104% | 8.3% |
Trial number 4 (R4) showed a significantly higher turbidity at harvest than the other cultures. This culture showed similar cell densities at time of transfection and the resulting titer was comparable to the other harvests used during this testing. A root cause of the high turbidity observed in trial 4 was not found.
Concentration
Due to the ratio of harvest titer to the binding capacity of the affinity sorbent, direct loading onto affinity chromatography would require extended loading times. The clarified material was concentrated by TFF before purification. This reduced the affinity chromatography loading time from >20 hours to ∼2 hours. For this process, we evaluated OmegaTM 100 kDa PES single-use TFF membrane cassettes. Ultrafiltration of rAAV products with 100 kDa pore size has been previously reported [13]Wright JF, Le T, Prado J et al. Identification of factors that contribute to recombinant AAV2 particle aggregation and methods to prevent its occurrence during vector purification and formulation. Mol. Ther. 2005; 12(1): 171–8. . A flux excursion study was performed to identify the optimal crossflow and TMP process parameters. The results of this study are shown in Figure 2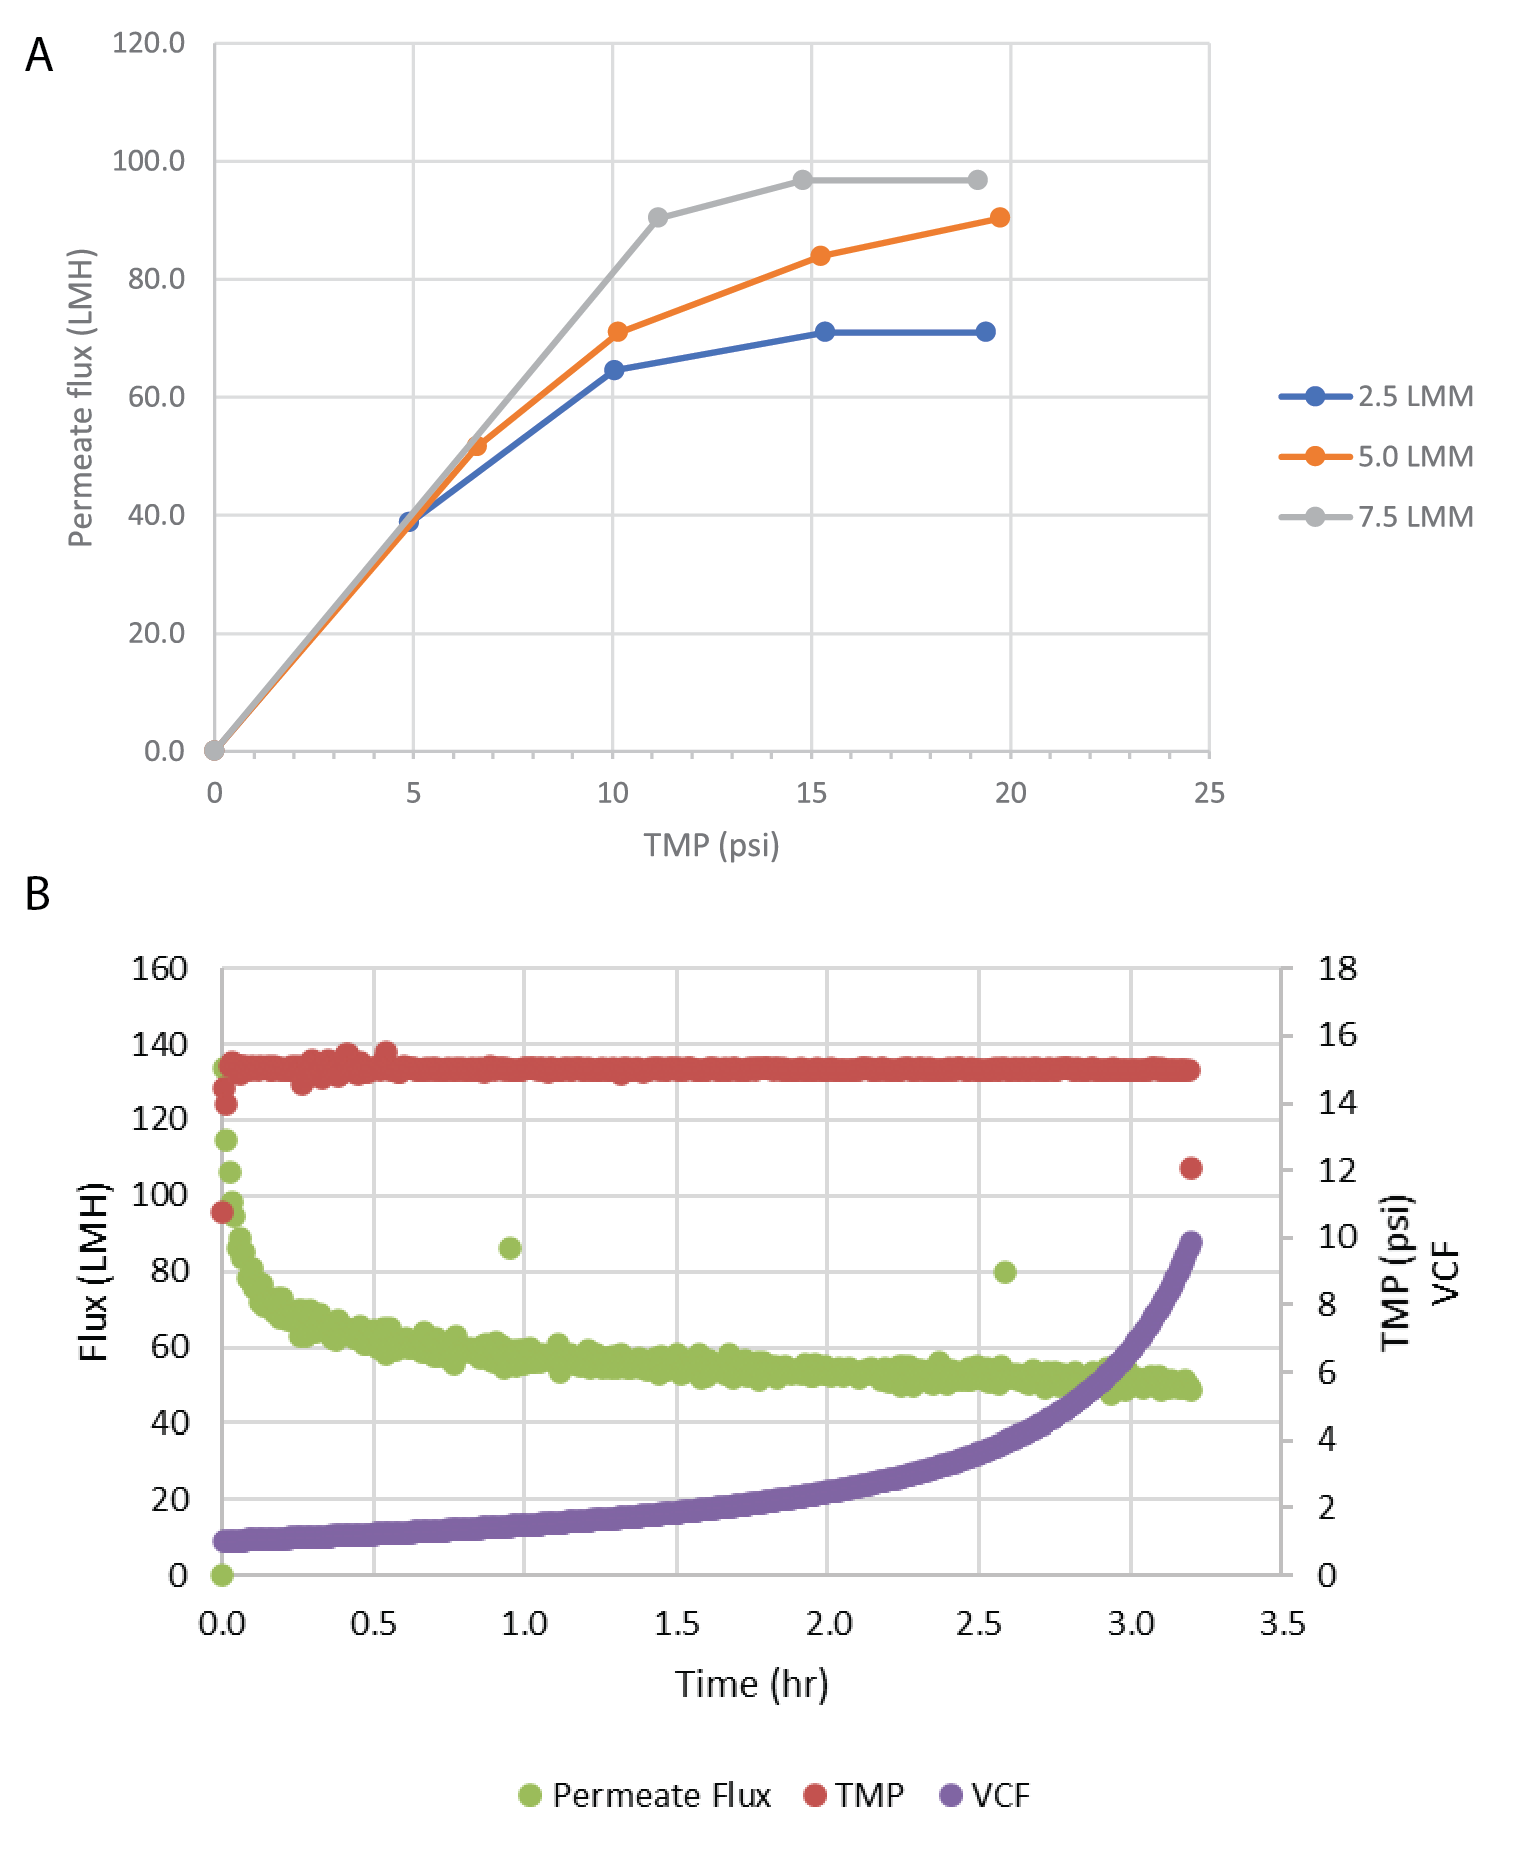
Six trials were performed to concentrate the clarified rAAV5 pool to a target volumetric concentration factor (VCF) of 10X. Across the trials, volumetric loading averaged 186 ± 9 L/m2, virus loading averaged 1.3 x 10¹⁵ ± 2.6 x 10¹⁴ gc/m2, and feed concentration averaged 7.3 x 10⁹ ± 1.5 x 10⁹ gc/mL. A summary of the filter performance is shown in Table 3 and includes an average vector step yield of 91% ± 8.0%. A representative plot of flux and VCF over time is shown in Figure 2B.
| Table 3 Summary of rAAV5 concentration by ultrafiltration TFF. | |||
| Attribute | Data points | Average | 95% confidence interval |
| Permeate flux | n=6 | 64 LMH | 5.6 LMH |
| Yield (ddPCR) | n=6 | 91% | 8.0% |
Chromatography purification
Affinity capture chromatography was performed and to speed up loading time, typically a single clarified harvest was purified on two columns simultaneously using two ÄKTA Avant chromatography systems. Across 16 total affinity chromatography purifications rAAV5 recovery was determined to be 68 ± 13% by capsid ELISA and 57 ± 30% by ddPCR method.
The affinity purified vector was polished to enrich for full capsids using Mustang® Q XT Anion Exchange membrane sorbent. The elution pool was diluted into Bis-tris propane (BTP) equilibration buffer to reduce the ionic strength of the material prior to polishing. After column washing, the virus was eluted from the membrane capsule using a
mS conductivity step elution strategy. A representative elution profile is shown in Figure 3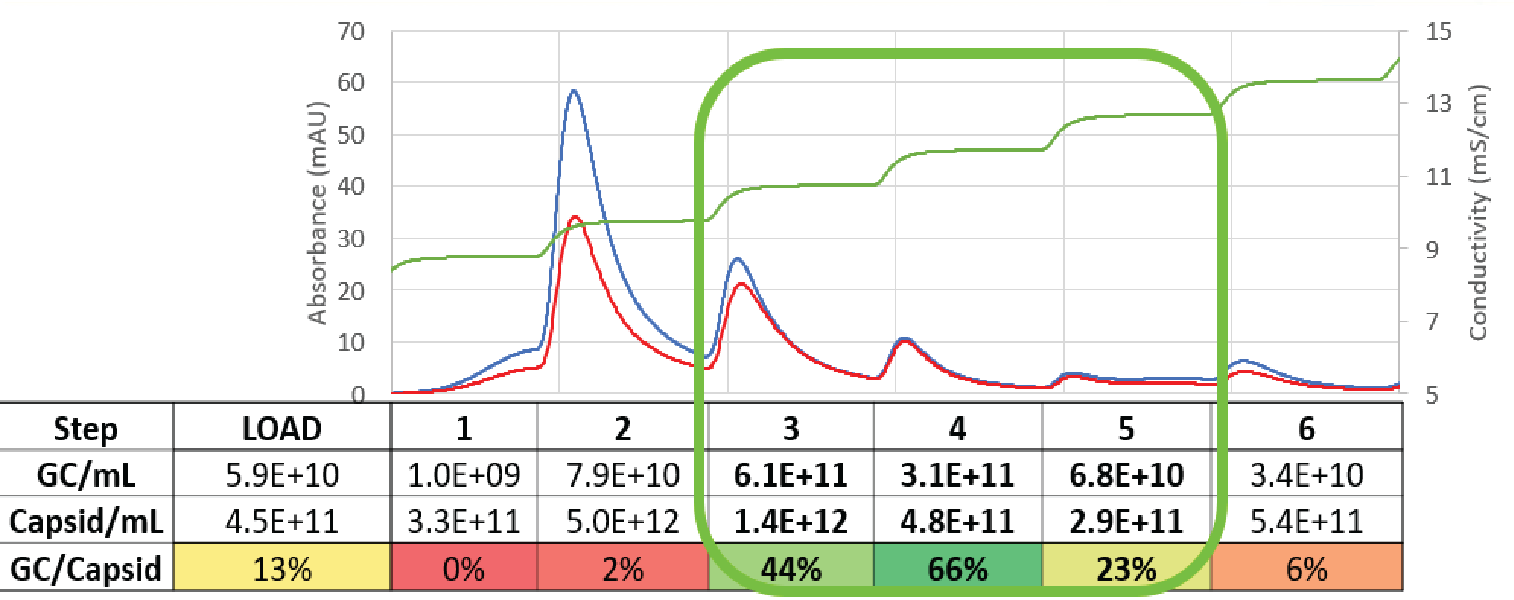
Elution fractions were analyzed for the gene of interest (the cargo) ‘full capsids’ using droplet digital polymerase chain reaction assay (ddPCR) and total capsids (AAV5 ELISA). Fractions that showed a higher absorbance at 280 nm than 260 nm correlated to low ratios of genome copies to total capsids, indicating a high percentage of empty capsids. The fractions with similar 280 nm and 260 nm signals showed a much higher ratio of genome copies to total capsids, indicating a higher proportion of full capsids.
When we calculate the mass balance from fraction pooling, we recover and carry forward close to 50% of the full capsids, but only retain 11% of the total viral particles. This results in close to a 5-fold enrichment of full capsids to total capsids.
Full capsid enrichment reproducibility
Mustang® Q polishing for full capsid enrichment was performed on five upstream batches, four of which were further analyzed via ddPCR and capsid ELISA. Figure 4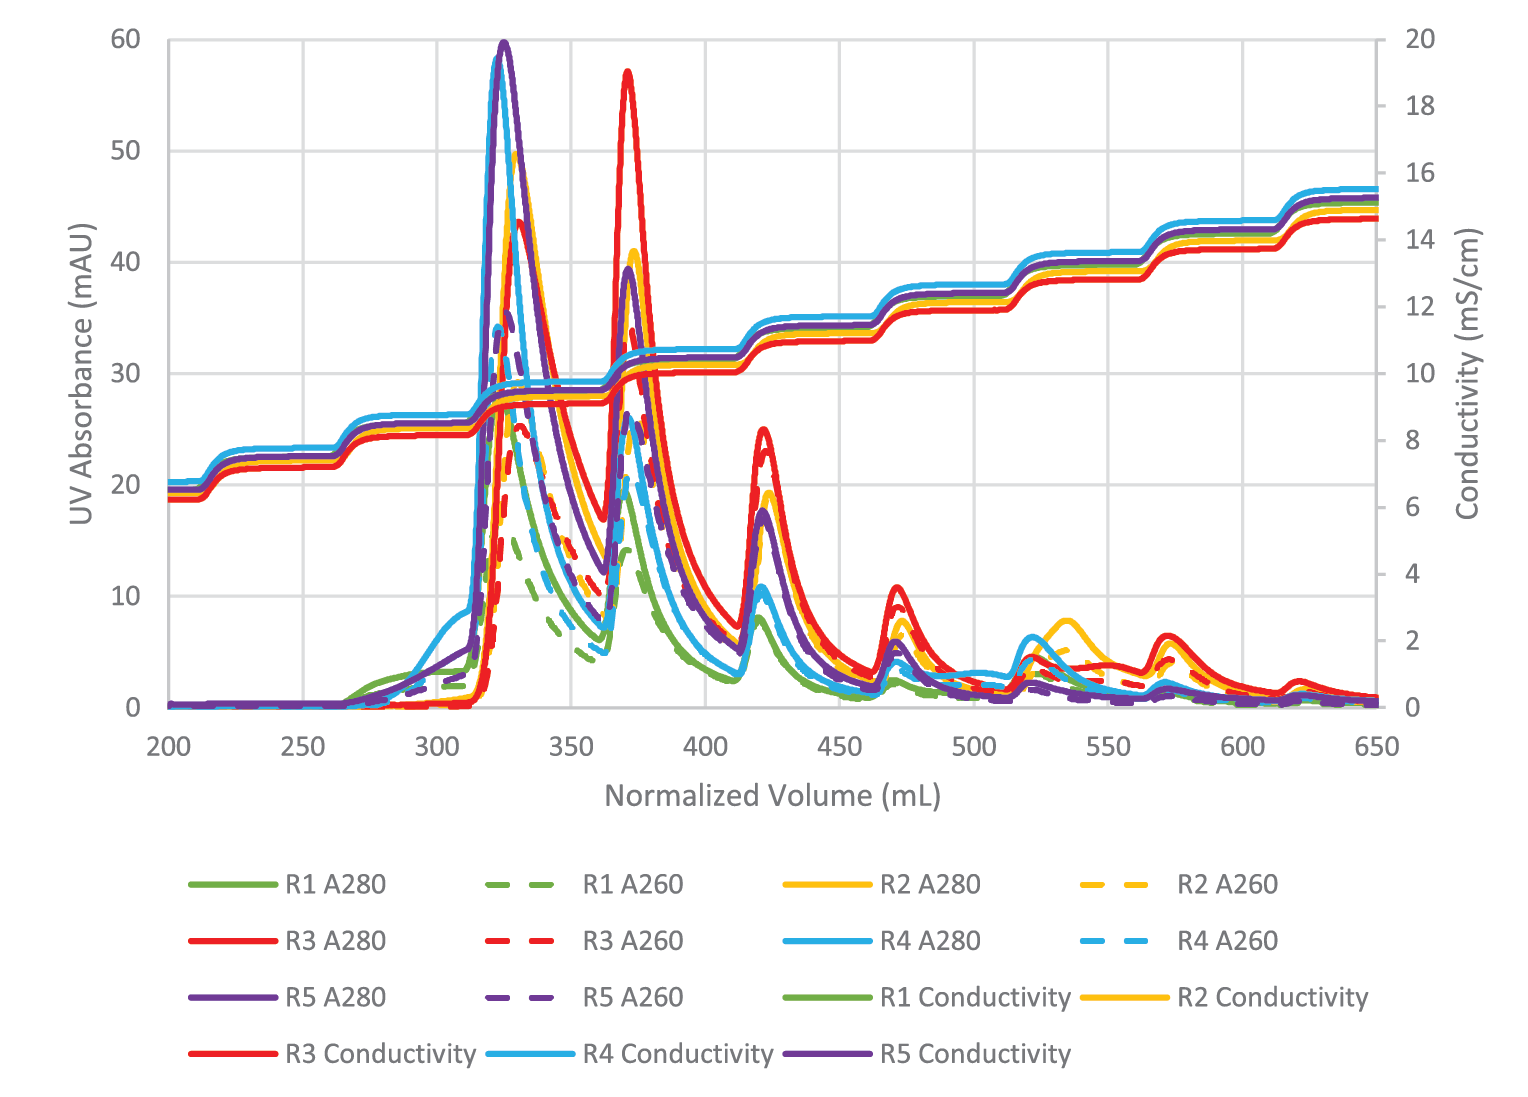
Despite variation in the upstream conditions, we found the full capsid enrichment with Mustang® Q to be reproducible. Figure 5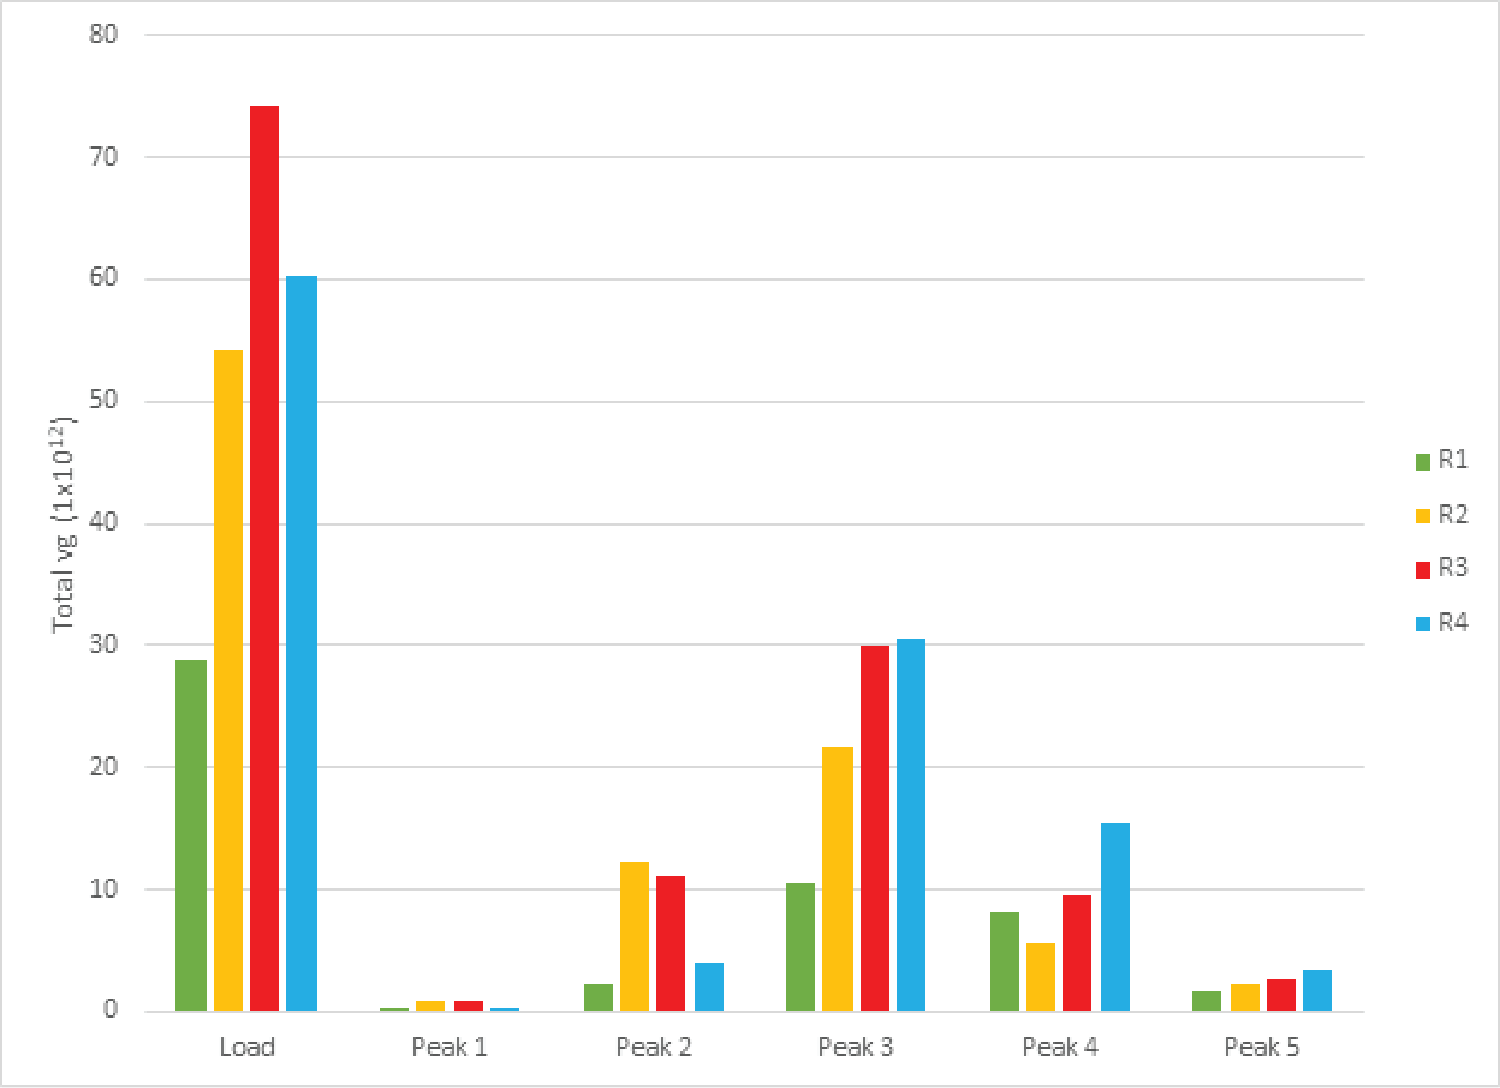
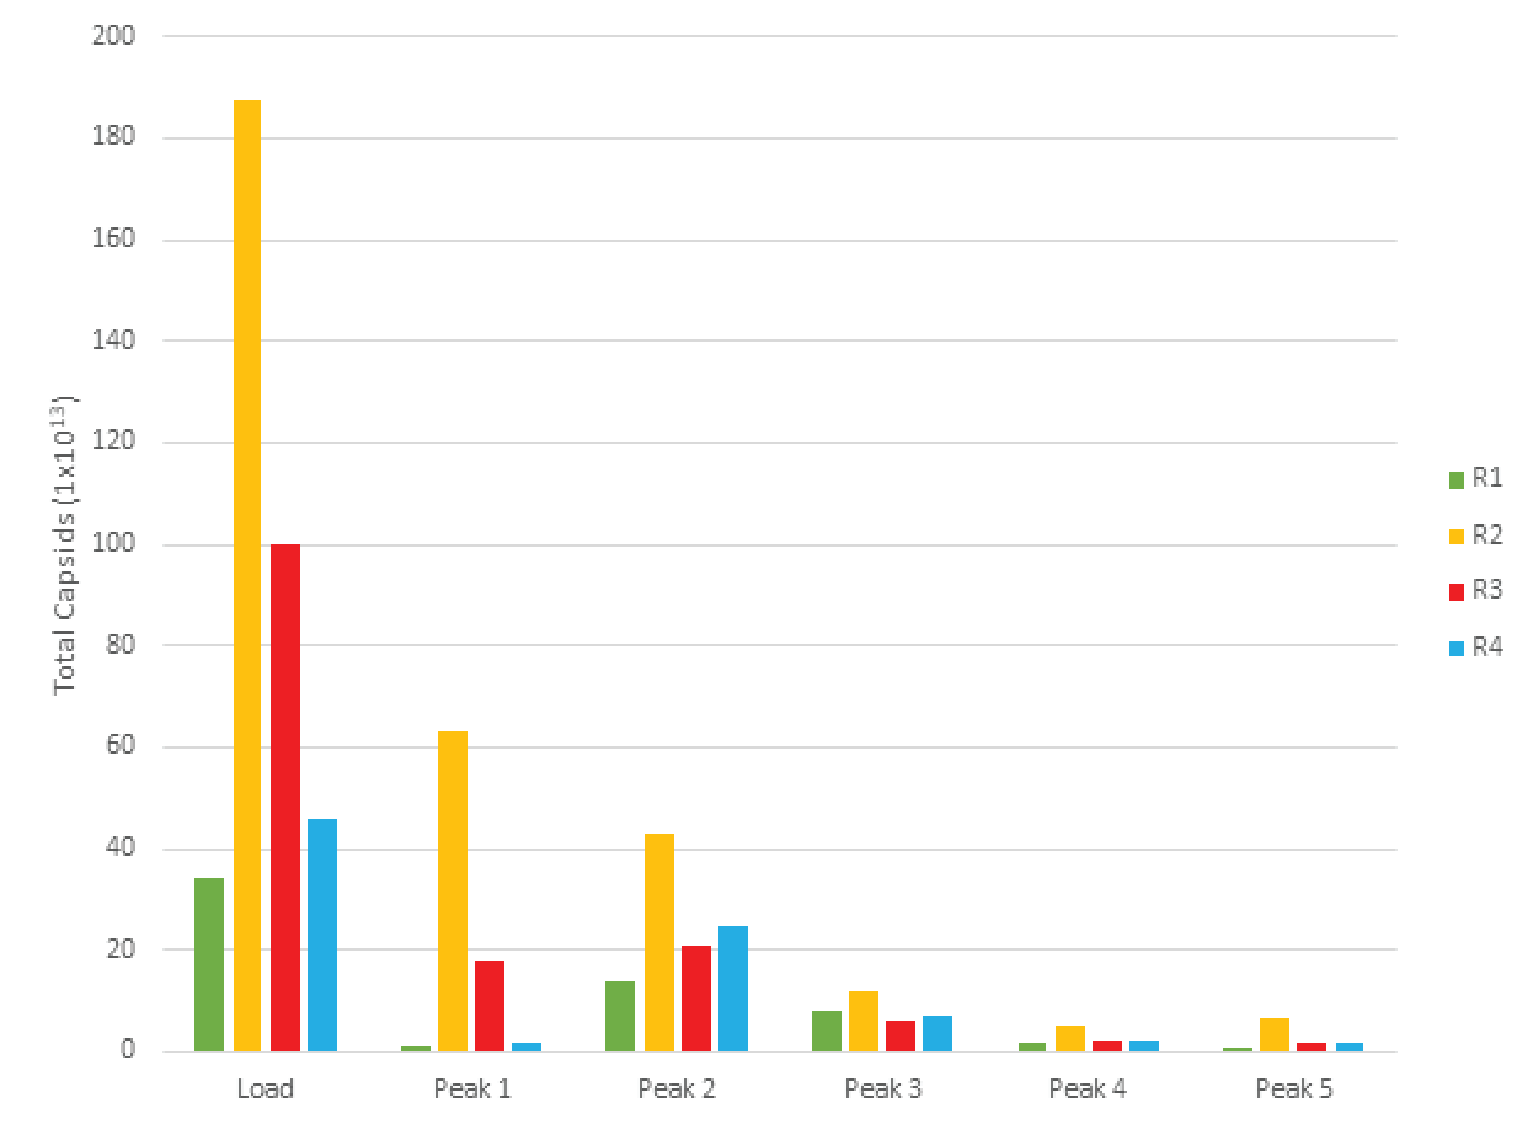
The combined peaks 1 and 2 reproducibly contain very little vector genomes (vg) (Figure 5), if any, and thus predominantly contain empty capsids. Peaks 3, 4 and 5 contain most of the genome content while the total number of capsids is low relative to combined peaks 1 and 2, indicating that these peaks are enriched for full capsids. To clearly demonstrate this phenomenon, we have divided the vg/capsid ratio of combined peaks 1 and 2 and combined peaks 3, 4 and 5, respectively, by the vg/capsid ratio of the load and plotted these in the Figure 7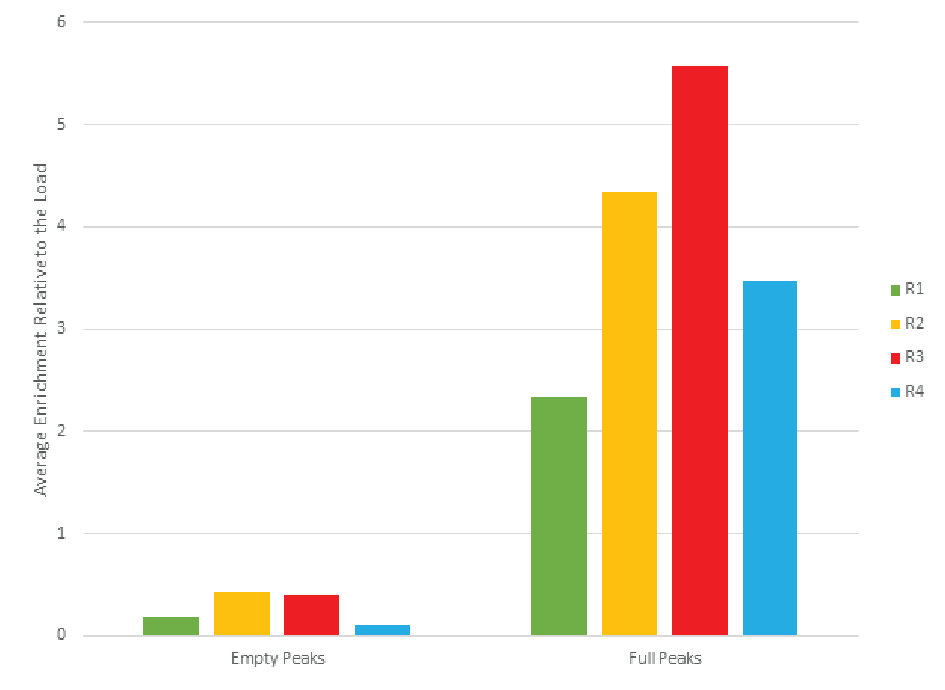
Table 4 shows the capsid ELISA yield and vg yield of the empty (1+2) and full (3+4+5) peaks. The total capsid yield in the empty peaks (1+2) is 49 ± 10% while the genome (vg) yield is only 14 ± 8%. The capsid yield in the full peaks (3+4+5) is 19 ± 10% while the genome (vg) yield is 66 ± 13%. This clearly shows that combined peaks 3, 4 and 5 are enriched in full capsid relative the combined peaks 1 and 2.
| Table 4 Average Mustang® Q polishing yield across processes. | |||||||
| Capsid yield | Vg yield | ||||||
| Empty peaks | Full peaks | Empty + full | Empty peaks | Full peaks | Empty + full | ||
| n | 4 | 4 | 4 | n | 4 | 4 | 4 |
| Average (%) | 49 | 19 | 68 | Average (%) | 14 | 66 | 80 |
| St dev (%) | 10 | 10 | 14 | St dev (%) | 8 | 13 | 7 |
Formulation
After Mustang® Q polishing, the next step in the process is to adjust the buffer and vector titer to the final formulation for clinical use. We evaluated the use of Omega 100 kDa single-use TFF filters for this ultrafiltration/diafiltration (UF/DF) step. The purified rAAV5 pool was concentrated to a targeted 10X volumetric concentration factor followed by a 7X diavolume buffer exchange into formulation buffer. The rAAV5 concentration/diafiltration was performed at a crossflow rate of 7.5 L/m2/min and a TMP of 15 psi. Following diafiltration the filter was depolarized and drained, then flushed with 1.5X holdup volumes of formulation buffer.
Four UF/DF trials were completed using the process described above. Permeate flux measured throughout the concentration and diafiltration remained steady at
00 LMH (concentration data shown in Figure 8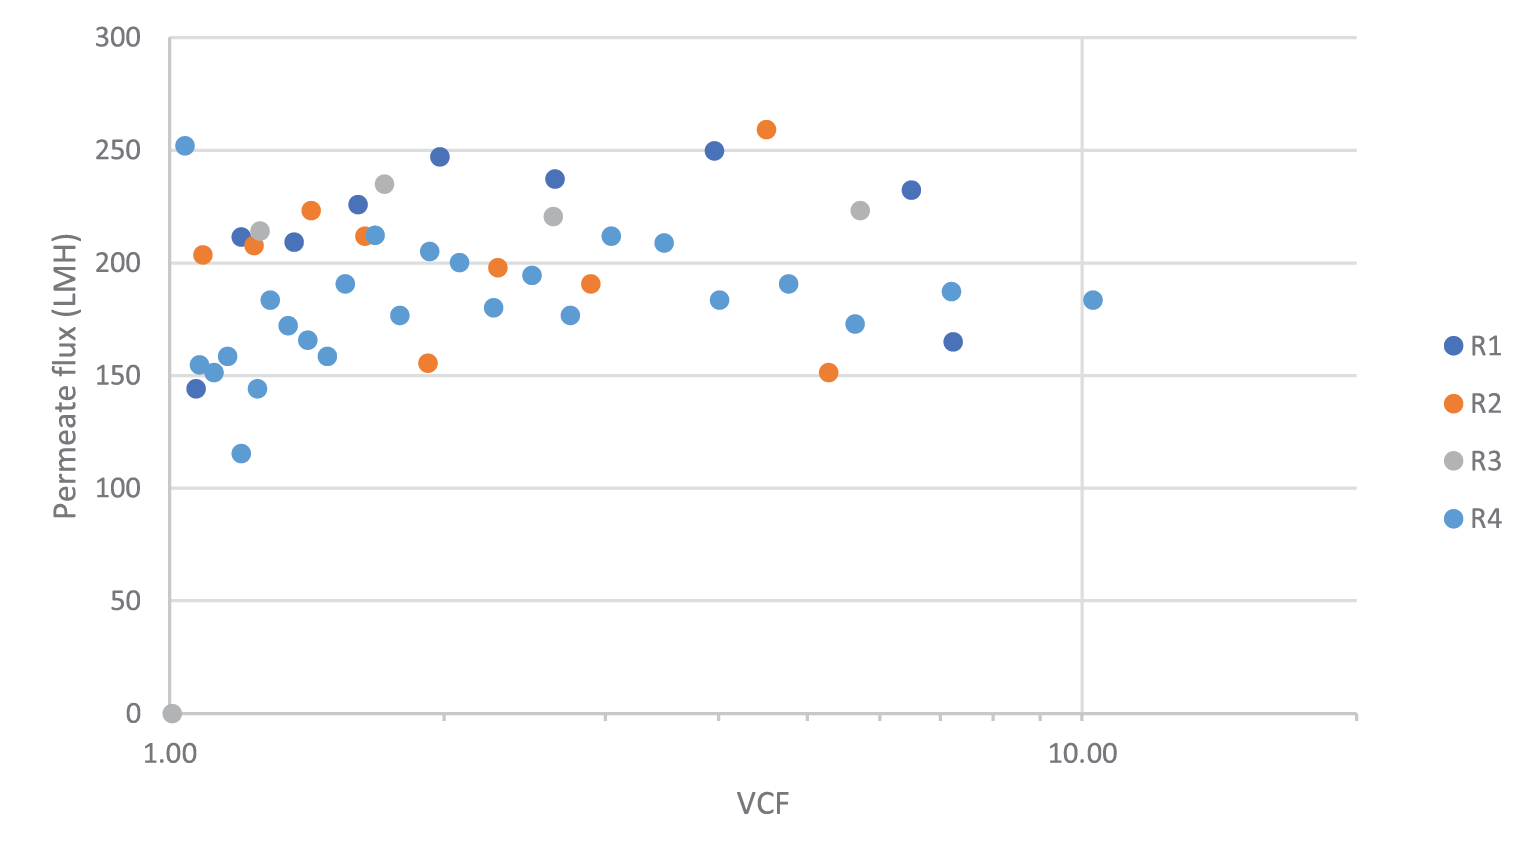
Final sterile filtration
The final step in rAAV manufacturing is to ensure patient safety by sterile filtration through a validated sterilizing-grade filter. We evaluated Supor® EKV for this final sterile filtration step. There was no significant pressure rise observed over the constant flow filtration experiments, though we note the loading was relatively low with the material available (<100 L/m2). Virus concentration was measured in the feed and filtrate pools to calculate transmission. The results of 4 trials are shown in Figure 9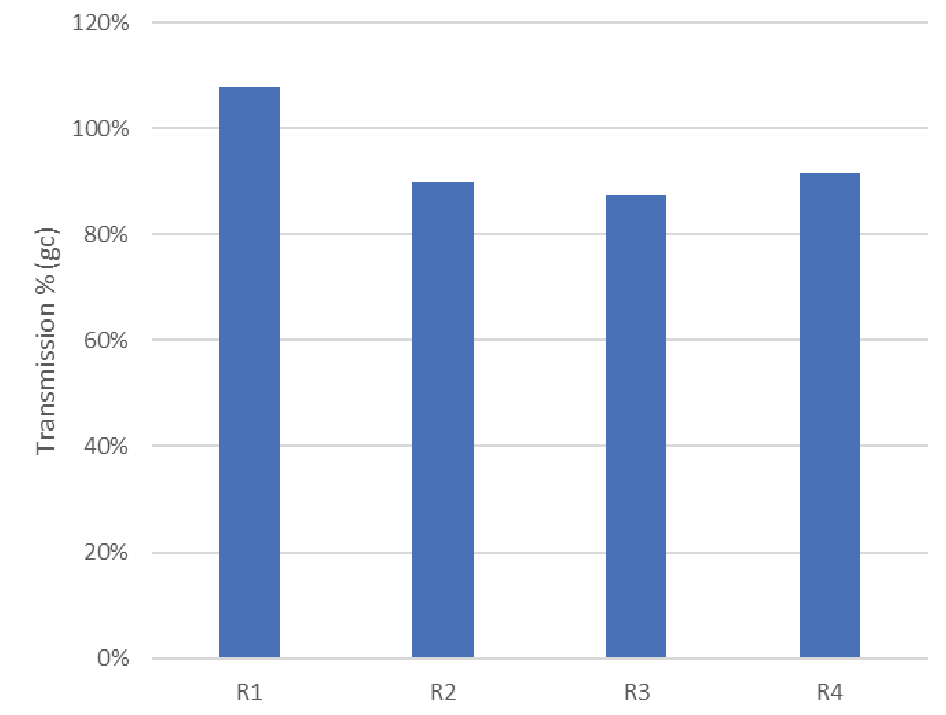
| Table 5 Summary of EKV sterile filtration performance for rAAV5. | |||
| Attribute | Data points | Average | 95% confidence interval |
| Feed concentration | n=4 | 3.3 e11 gc/mL | 1.5 e11 gc/mL |
| Transmission (ddPCR) | n=4 | 94% | 9.1% |
Total process yield & impurity removal
The step and cumulative vector yields from a representative run are shown in Figure 10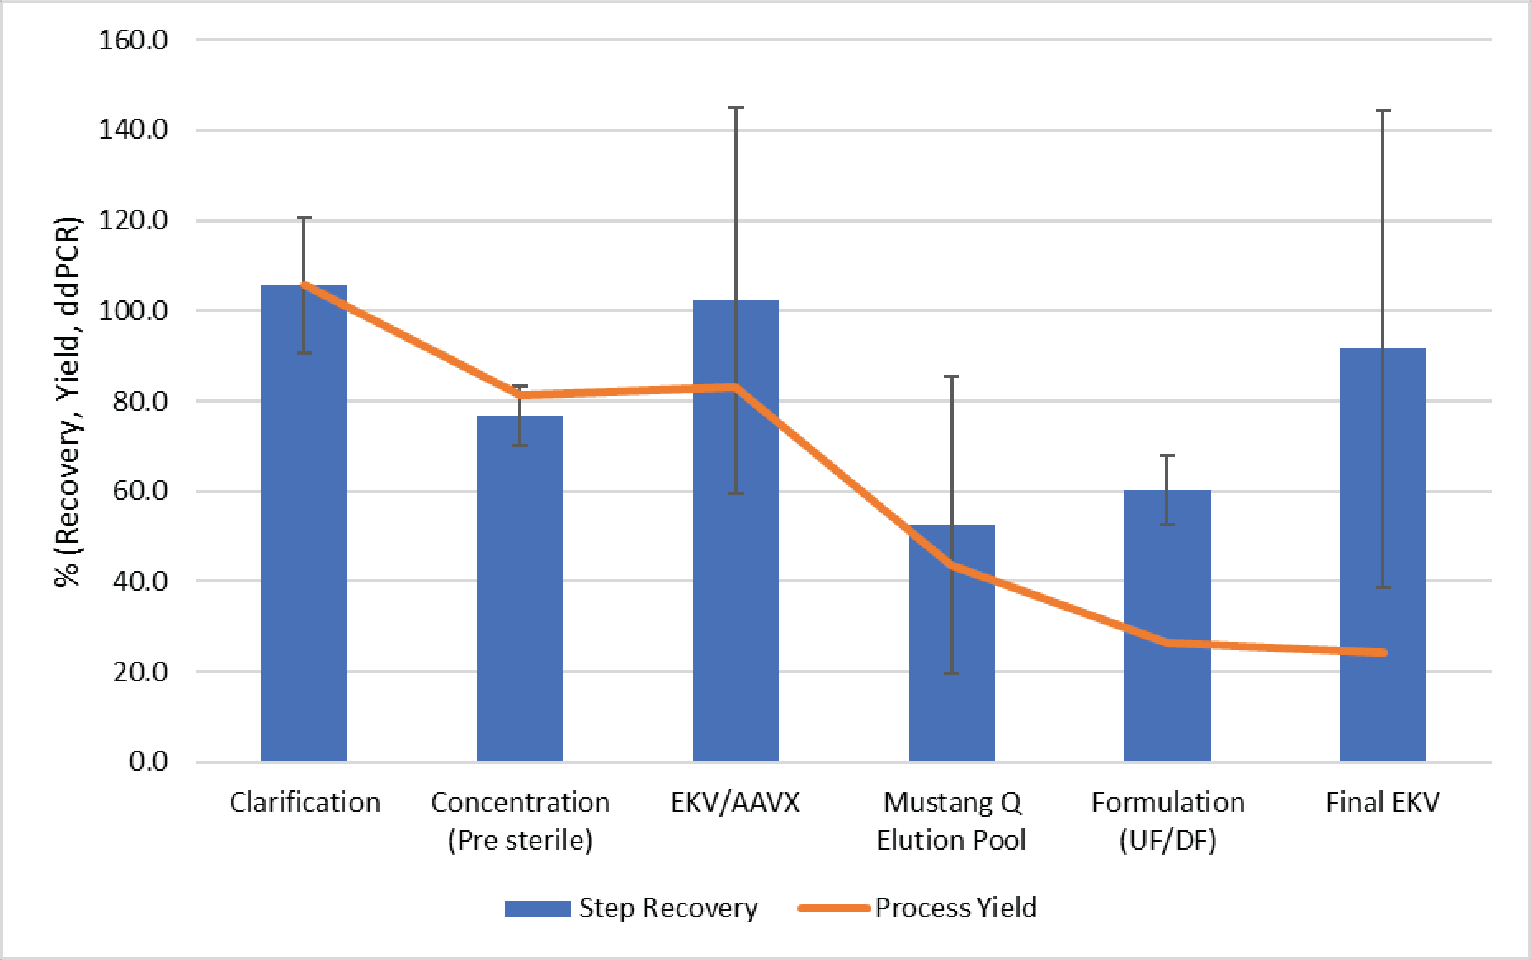
In this run, we observed good vector yield in clarification, concentration, affinity purification and final sterile filtration. The yields observed during Mustang® Q purification show ~50% vector recovery; however, this loss was also accompanied by an 89% reduction of total capsids resulting in a ~5-fold increase in full capsid percentage.
Final formulation by UF/DF resulted in ~60% vector recovery. This less-than-ideal recovery was likely a result of this process being performed using an atypically low volume to surface area for this application. Based on the process flux measured here, final formulation by TFF could target a volume to surface area ratio of 250 L/m2 in a 2–3 hour process. In this testing, we were limited by product volume and the resulting surface area to volume ratio was ∼15 L/m2. The pre-purification UF concentration of this vector resulted in an average yield >90% using the same filter, with a more appropriate volume to surface area ratio. We anticipate higher recoveries during scale-up as the relative impact of non-specific loss would be lowered.
The process was evaluated for contaminant removal including host cell proteins (HCP) and host cell DNA. Host cell protein concentration was determined by ELISA (Cygnus). Results are shown in Figure 11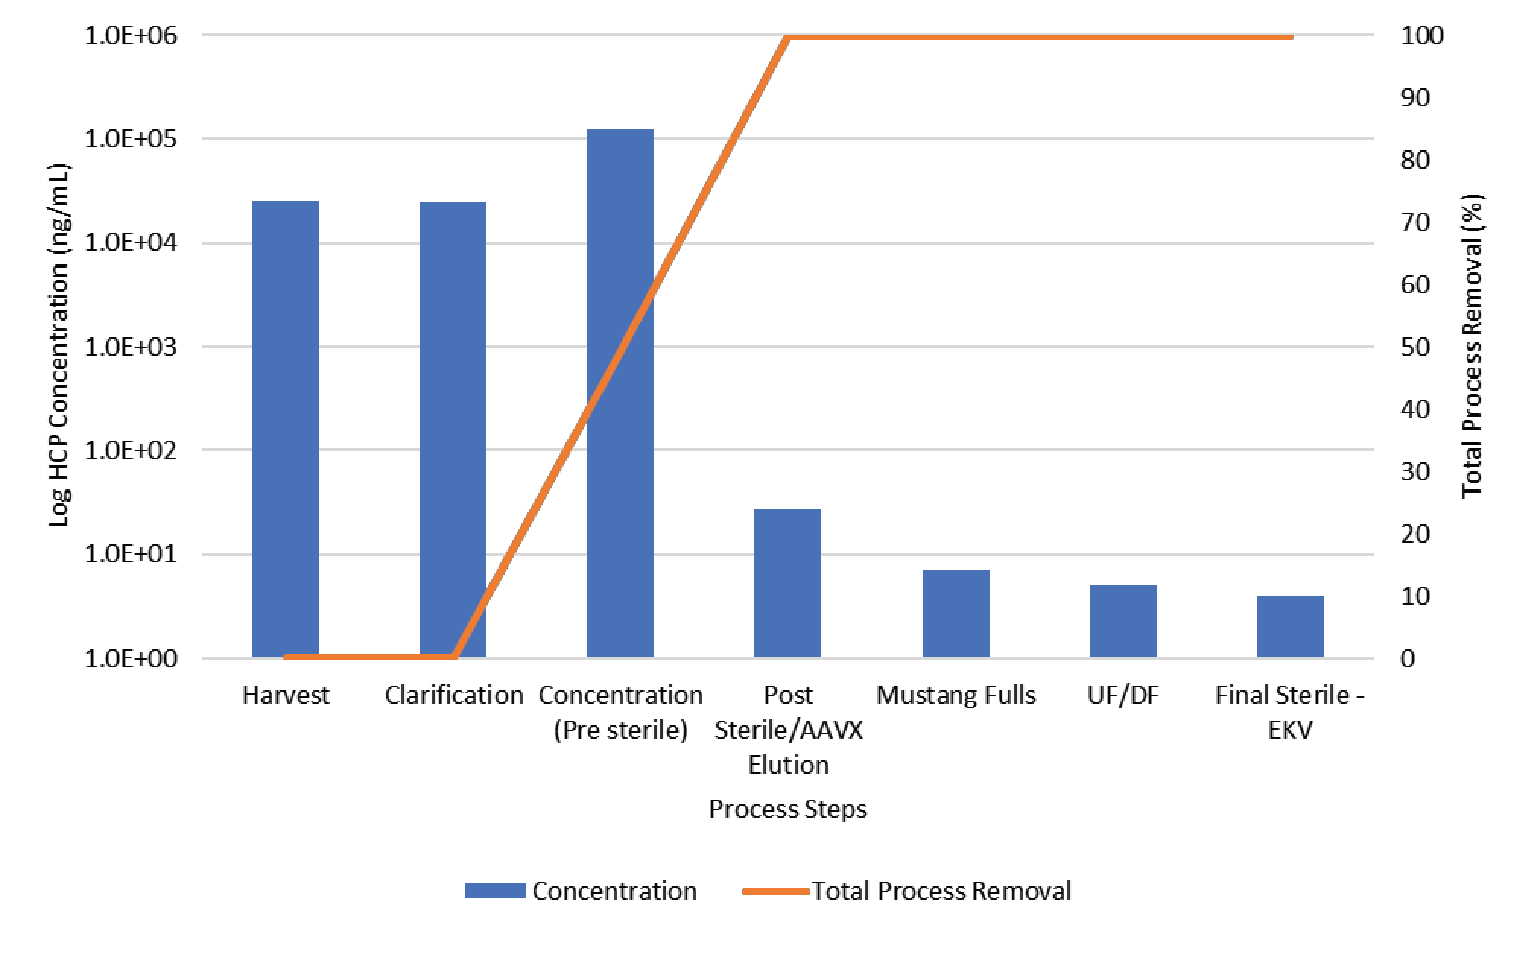
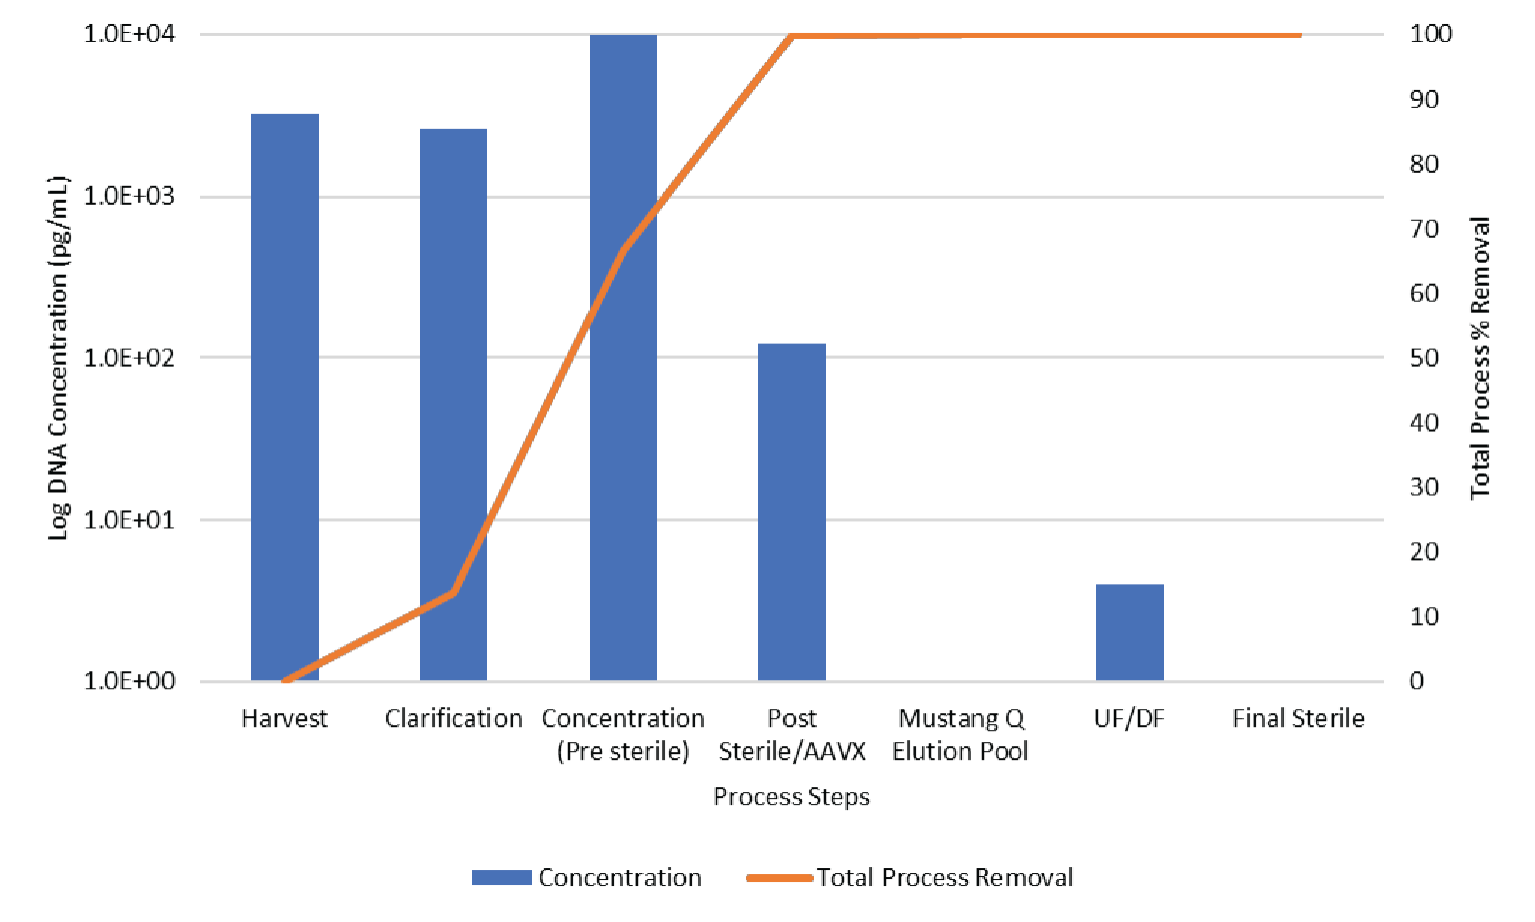
The data shown in Figures 11 & 12 show the contaminant HCP and DNA levels are both reduced to below assay limit of quantitation during Mustang® Q polishing.
The protein profile through the purification process was assessed by SDS-PAGE using Sypro™ Ruby fluorescent staining (see Figure 13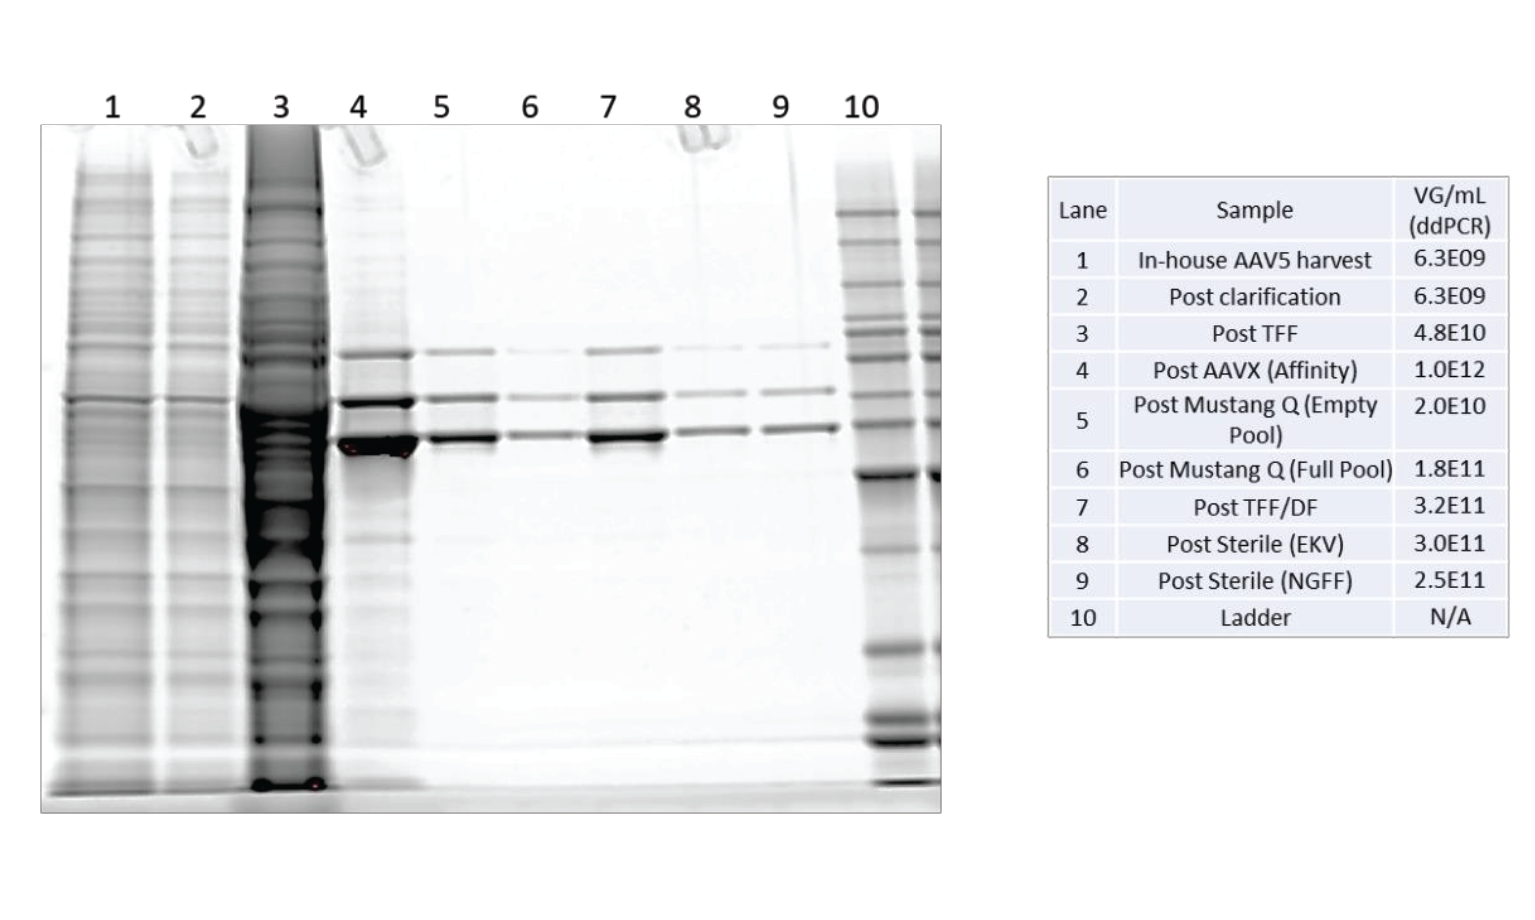
The results from the SDS-PAGE gel show a complex protein mixture through clarification and TFF. As expected, affinity purification shows a substantial reduction in the number and intensity of contaminant proteins. There are only 3 significant bands observed in all samples after Mustang Q polishing. These three bands are the viral capsid VP1, VP2 and VP3 proteins. There are no other significant proteins found in these samples.
The results of the DNA, HCP and SDS-PAGE analysis show this purification scheme results in a very low contaminant profile.
Conclusions
We evaluated existing filtration and chromatography technologies commonly used in large scale recombinant protein purification, for the purification of a recombinant AAV vector (serotype 5). The purification strategy was based on the general platform process commonly utilized in large-scale industrial monoclonal antibody manufacturing including scalable clarification, affinity purification, ion-exchange polishing, tangential flow filtration and sterile filtration. Each unit operation was evaluated for vector yield based on droplet digital PCR, purity, and robustness.
We observed an overall theoretical process yield of 25% full capsids (containing gene of interest) with a full capsid enrichment of ~5-fold compared to the total viral particles (total capsids including empty). This process resulted in rAAV material which had a very low HCP and DNA contaminant profile. Clarification, TFF concentration and final sterile filtration showed robust performance with average vector recovery >90%. The unit operations with the most vector loss were Mustang® Q polishing and UF/DF final formulation. We expect the total process yields to improve with further optimization, process understanding and scale-up.
Translational insights
The results presented here demonstrate feasibility of translating proven, scalable purification technologies used in recombinant protein manufacturing to the purification of viral vectors. Almost all the technologies employed are available from Pall Corporation. This enables a near complete end-to-end platform solution for recombinant adeno-associated viral vector manufacturing.
Next steps would likely include scalability of each unit operation, particularly for the final UF/DF and final filtration, where scale-up is required to further challenge the filters. To develop a full Quality by Design (QbD) manufacturing process would also require additional characterization of critical process parameters for each unit operation. A white paper outlining guidance on QbD manufacturing of rAAV products is available from Pall Corporation [14]Quality by Design (QbD) for Adeno-Associated Virus (AAV): A Framework for a QbD Assessment for AAV Products Within the Chemistry Manufacturing and Controls (CMC) Documentation. Pall Corporation, Biotech white paper USD 3537. .
References
1. Ayuso E. Manufacturing of recombinant adeno-associated viral vectors: new technologies are welcome. Mol. Ther. Methods Clin. Dev. 2016; 3: 15049. Crossref
2. FDA approves novel gene therapy to treat patients with a rare form of inherited vision loss. FDA, released December 18, 2017. Crossref
3. FDA approves innovative gene therapy to treat pediatric patients with spinal muscular atrophy, a rare disease and leading genetic cause of infant mortality. FDA, released May 24, 2019. Crossref
4. Mendell JR, Al-Zaidy SA, Rodino-Klapac LR et al. Current Clinical Applications of In Vivo Gene Therapy with AAVs. Mol. Ther. 2021; 29(2): 464–88. Crossref
5. Von Drygalski A, Giermasz A, Castaman G et al. Etranacogene dezaparvovec (AMT-061 phase 2b): normal/near normal FIX activity and bleed cessation in hemophilia B. Blood Adv. 2019; 3(21): 3241–7. Crossref
6. Wang D, Tai PWL, Gao G. Adeno-associated virus vector as a platform for gene therapy delivery. Nat. Rev. Drug Discov. 2019; 18: 358–78. Crossref
7. Kelley B. Very large scale monoclonal antibody purification: the case for conventional unit operations. Biotechnol. Prog. 2007; 23(5): 995–1008. Crossref
8. Shukla AA, Hubbard B, Tressel T, Guhan S, Low D. Downstream processing of monoclonal antibodies--application of platform approaches. J. Chromatogr. B Analyt. Technol. Biomed. Life Sci. 2007; 848(1): 28–39. Crossref
9. Cadence™ Single-Use Tangential Flow Filtration (TFF) Modules with Omega Membrane, Pall Corporation, Instructions for use USD 2896. Crossref
10. T-Series TFF Cassettes with Omega™ Membrane Care and Use Procedures, Pall Corporation, Biotech User Guide, USTR 2433b. Crossref
11. Zolgensma (onasemnogene abeparvovec-xioi)[package insert] – Novartis Bannockburn, IL (2019). Crossref
12. Vandenberghe LH, Xiao R, Lock M, Lin J, Korn M, Wilson JM. Efficient serotype-dependent release of functional vector into the culture medium during adeno-associated virus manufacturing. Hum. Gene Ther. 2010; 21(10): 1251–7. Crossref
13. Wright JF, Le T, Prado J et al. Identification of factors that contribute to recombinant AAV2 particle aggregation and methods to prevent its occurrence during vector purification and formulation. Mol. Ther. 2005; 12(1): 171–8.
14. Quality by Design (QbD) for Adeno-Associated Virus (AAV): A Framework for a QbD Assessment for AAV Products Within the Chemistry Manufacturing and Controls (CMC) Documentation. Pall Corporation, Biotech white paper USD 3537. Crossref
Affiliations
Shawn Tansey
Pall Corporation; Westborough MA, USA
Adam Hejmowski
Pall Corporation; Westborough MA, USA
Rajeshwar Chinnawar
Pall Corporation; Westborough MA, USA
Michelle Olson
Pall Corporation; Westborough MA, USA
Anne MacIntyre
Pall Corporation; Westborough MA, USA
Amanda Rose
Pall Corporation; Westborough MA, USA
Kurt Boenning
Pall Corporation; Westborough MA, USA
Julio Huato
Pall Corporation; Westborough MA, USA
Terese Joseph
Pall Corporation; Westborough MA, USA
Mark Schofield
Pall Corporation; Westborough MA, USA
Aydin Kavara
Pall Corporation; Westborough MA, USA
Nick Marchand
Pall Corporation; Westborough MA, USA
Mike Collins
Pall Corporation; Westborough MA, USA
Todd P Sanderson
Pall Corporation; Westborough MA, USA

Authorship & Conflict of Interest
Contributions: All named authors take responsibility for the integrity of the work as a whole, and have given their approval for this version to be published.
Acknowledgements: None.
Disclosure and potential conflicts of interest: The authors disclose that Pall Corporation owns patents relevant to the Biotech Industry. The authors are Pall Corporation employees.
Funding declaration: The authors received no financial support for the research, authorship and/or publication of this article.
Article & copyright information
Copyright: Published by Cell and Gene Therapy Insights under Creative Commons License Deed CC BY NC ND 4.0 which allows anyone to copy, distribute, and transmit the article provided it is properly attributed in the manner specified below. No commercial use without permission.
Attribution: Copyright © 2021 Pall Corporation. Published by Cell and Gene Therapy Insights under Creative Commons License Deed CC BY NC ND 4.0.
Article source: Invited; externally peer reviewed.
Submitted for peer review: Nov 11 2021; Revised manuscript received: Dec 1 2021; Publication date: Dec 10 2021.