Alternative solutions to separate AAV full and empty capsids using anion exchange
Cell & Gene Therapy Insights 2024; 10(5), 673–686
DOI: 10.18609/cgti.2024.081
AAV is the primary vector for gene therapy, and in order to enable more mainstream applications with larger patient populations, it will prove crucial to have scalable, cost-effective, and resilient chromatography-based purification methods. Central to a successful process is the attainment of high overall yields of full capsids alongside an effective reduction of empty capsids and efficient removal of impurities. This article introduces high-performance anion exchange chromatography separation techniques in step-elution mode for various AAV serotypes, detailing optimized protocols and conditions for both membrane and resin formats.
AAV in gene therapy
Developing a cost-effective manufacturing strategy for AAV-based therapies is essential for these therapies to reach broader patient populations. A major challenge in AAV manufacturing is the inconsistent production of full capsids, which are essential for effective treatment. The percent of full capsids typically ranges from 10%–40%, and achieving high levels of full capsid enrichment remains difficult.
Additionally, these treatments often require high doses of AAV, which can pose toxicity risks. Increasing the proportion of full capsids while reducing empty capsids is crucial for lowering overall dosage and ensuring treatment efficacy.
AAV process: upstream, downstream, and analysis
In the AAV manufacturing space, a robust platform is beginning to emerge. At the upstream stage, conventional practice involves triple plasmid transfection of HEK293 cells transitioning to suspension cell culture. This method, predominantly employed in this study, utilizes the Xcellerex™ bioreactor from Cytiva, primarily featuring a green fluorescent protein transgene.
The ELEVECTA™ producer cell line from Cytiva was also used—this approach integrates all necessary genes for AAV production stably within the cell line, thereby eliminating the need for plasmids and helper viruses. This not only streamlines the process but also has the potential to substantially reduce production costs and ensure greater consistency across batches.
The Cytiva platform encompasses the complete AAV production and purification process. Moving to downstream processing, it includes steps from clarification to final formulation and fill. Two chromatography steps are incorporated into the process, due to the importance of achieving high purity. Notably, the only place within the AAV purification process that can impact the enrichment of full capsids is the polishing. Anion exchange (AEX) chromatography stands out as an effective technique for the polishing step. Operating at high pH levels, typically around 9, this method imparts a negative charge to the capsids, facilitating their binding to positively charged Q chemistry AEX. Optimizing the separation process for enhanced purity and efficacy is an important focus for the field.
The third element of the process is analytics. Although playing a pivotal role, particularly in quantifying full capsids, ensuring robust analytics for AAV can prove challenging. When using UV, PCR, and ELISA data for assessing analytics it is important to bolster findings with orthogonal data such as analytical ultracentrifugation (AUC) or mass photometry.
Full and empty capsid separation
While effective separation for full and empty capsids can be achieved in AAV manufacturing via ultracentrifugation, challenges remain due to limited scalability. Significant manual handling and operator variation renders capsid separation via ultracentrifugation less suitable for clinical or manufacturing scales, thus there has been a shift among manufacturers towards employing AEX chromatography for the enrichment of full capsids for AAV.
Cytiva offers two distinct chromatography solutions for scaling up capsid separation using AEX chromatography, one of which is the Mustang™ Q membrane chromatography. Through continuous efforts, flow rates have been optimized, achieving operation at up to 10 membrane volumes per minute. This facilitates reduced cycle times, thus enabling rapid iterations. Further, compatible units that are scalable in size result in a versatile range. All Mustang units feature a consistent 16-layer membrane configuration, ensuring uniform chromatography performance across the entire spectrum. The second solution for AEX chromatography is the Capto™ Q resin, with advantages such as pre-packed and flexible sizing, and high-resolution capabilities.
Process development: elution steps for precise separations
For AEX, our AAV process development approach begins with testing elution behavior with small conductivity steps of 0.5–1 mS/cm. These adjustments are easily implemented using the ÄKTA™ chromatography system by operating a step gradient from pump A to pump B in small percentage increments.
These conductivity steps yield detailed elution chromatograms, enabling visual interpretation of the separation process. Monitoring the separation via the 260 nm and 280 nm UV ratio provides valuable insights. Given that capsids are primarily composed of protein with peak absorbance of 280 nm, and encapsulated DNA with peak absorbance of 260 nm, early peaks with high 280:260 ratios signify empty capsids lacking nucleic acid. Conversely, later peaks with higher 260:280 ratios indicate enrichment for full capsids containing nucleic acid, as shown in Figure 1 Assessing optimal conductivity for removing the empty capsid is achieved by elution with small incremental conductivity steps (0.5–1 mS/cm).The changes of the UV260:UV280 ratio inform selection of the conductivity for elution of AAV9 empty capsids in the final two-step protocol using Mustang Q.. This visual assessment aids the selection of conditions during process development, facilitating immediate adjustments and optimization.
Moreover, the incremental steps lend themselves to a simplified two-step elution method. By identifying the conductivity threshold for eluting empty capsids, and subsequently implementing a higher conductivity to elute full capsids, a simplified two-step separation strategy can be achieved. While this approach yields good results, the limits of the separation process can be explored to maximize full capsid yield and robustness.
Two-step process development: first elution step length
Moving to a two-step elution we initially focused on the duration of the first elution step to desorb empty capsids while retaining full capsids. Varying the step length from 5–25 membrane volumes showed consistent first peak height but increased tailing. This indicated greater material elution and therefore a reduction in the size of the second peak (where full capsids reside). Analyzing the data with ELISA and ddPCR showed a decrease in capsids in the second elution peak while vector genomes exhibited a slower decline. Consequently, extending the first elution step increased the percentage of full capsids, offering a valuable parameter for optimization and improving separation. The conductivity of the first elution step was also investigated as a factor. By manipulating the conductivity and the volume of the first elution step, a design space can be identified.
AAV8 response and optimization for separation
Using a face-centered design with axial points, response surfaces to create performance maps of the separation process’s robustness were generated. For AAV8, two charts were generated, depicting the relationship between step length (y-axis) and first-step conductivity (x-axis), as shown in Figure 2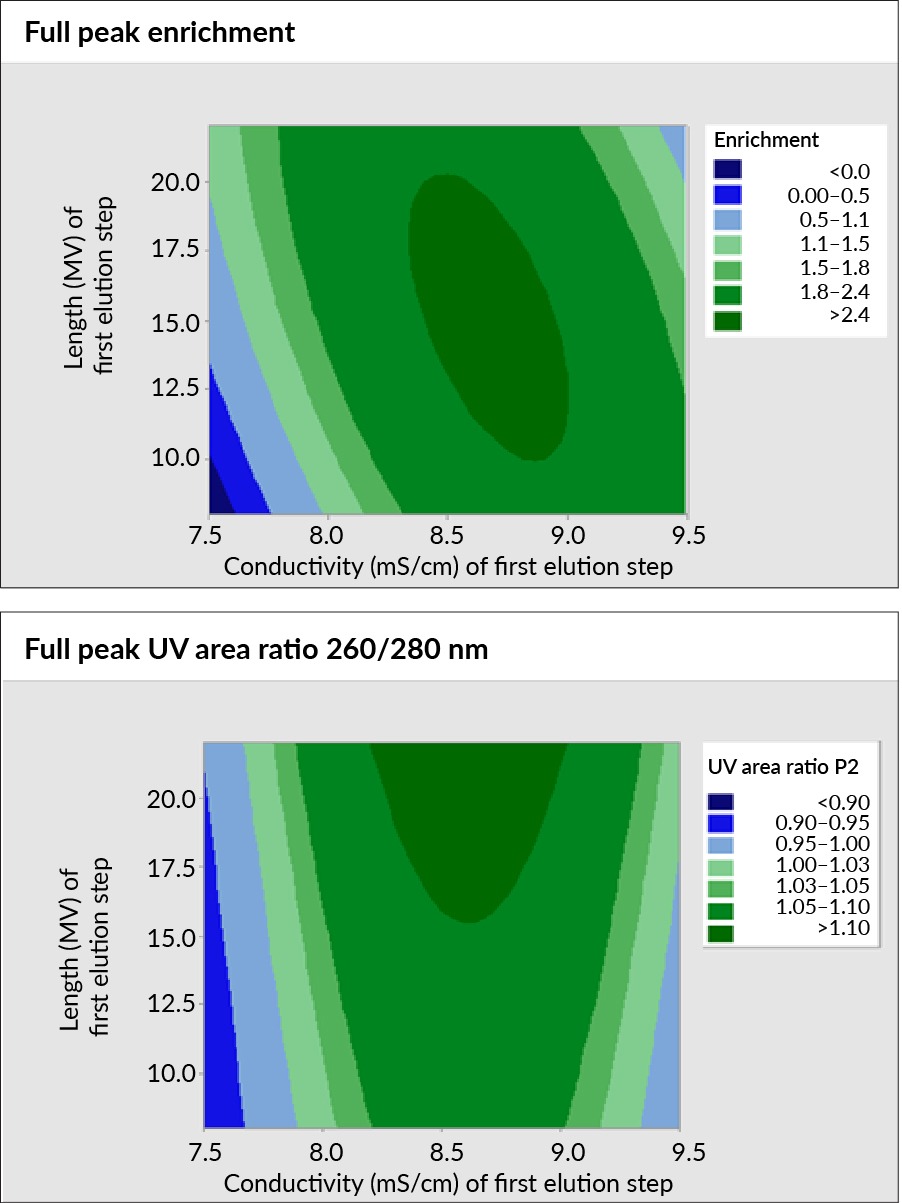 Performance maps of the separation process robustness of AAV8 step length and first step conductivity using Mustang Q.. The charts represent the percent full in two ways: through the 260:280 nm ratio and full peak enrichment of the full capsids using ddPCR versus ELISA data.
Both maps show good performance and improvement in full capsids, with a conductivity range typically just over 1 mS/cm. However, they differ in guiding optimal elution step length. The 260:280 nm map suggests longer first elution steps, while the ddPCR versus ELISA data suggests a more modest elution step length.
The generated response surface models were then validated by conducting individual experiments using the predicted optimized parameters. Individual runs were performed for both maps, as well as a process with the conditions derived from the 0.5 mS/cm conductivity steps. Across all of these conditions, a vector genome yield ranging from 70%–94% was observed. Furthermore, significant full capsid enrichment was achieved under the condition predicted from the UV 260:280 nm map. Here, an approximately 75% full capsid yield was attained, aligning well with the ddPCR, ELISA, and mass photometry data. Starting from approximately 20% full, about a 2.5-fold enrichment was achieved.
AAV8: scalability of Mustang Q XT 140
The conditions from the UV 260:280 area ratio were taken and scaled up to mimic a clinically relevant manufacturing scale: transitioning from a 0.86 mL capsule to the 140 mL Mustang Q XT capsule. Sharing the same number of Mustang layers and maintaining an equal ratio of membrane to hold-up volume instilled assurance in the scaling process, further reflected by the chromatograms. Loading the same amount of virus per volume of the unit resulted in highly similar chromatograms.
Assessing the performance, it became evident that the vector genome yield was slightly higher on the XT 140 as outlined in Table 1. This could be attributed to reduced non-specific losses when scaling up to larger volumes; however, the percentage of full capsids experienced a small decrease. With the 1 mL unit, around 70% full capsids were achieved, whereas with the 140 mL unit, this decreased to approximately 60%. Nonetheless, overall performance remained notable, with consistent UV area ratios and highly similar chromatograms, underscoring the success of scale-up efforts with AAV8.
| Table 1. AAV8 separation performance of Acrodisc™ 0.86 mL capsule vs Mustang Q XT 140 mL capsule. | ||
|---|---|---|
| Metric on full peak | Acrodisc 0.86 mL capsule | Mustang Q XT 140 mL capsule |
| Vector genome yield (%) | 71 | 93 |
| Percent full (ELISA/ddPCR) | 68 | 50 |
| Enrichment (fold) | 3.4 | 2.5 |
Following this, a similar approach was adopted for other serotypes, namely AAV5 and AAV9. The data presented in Figure 3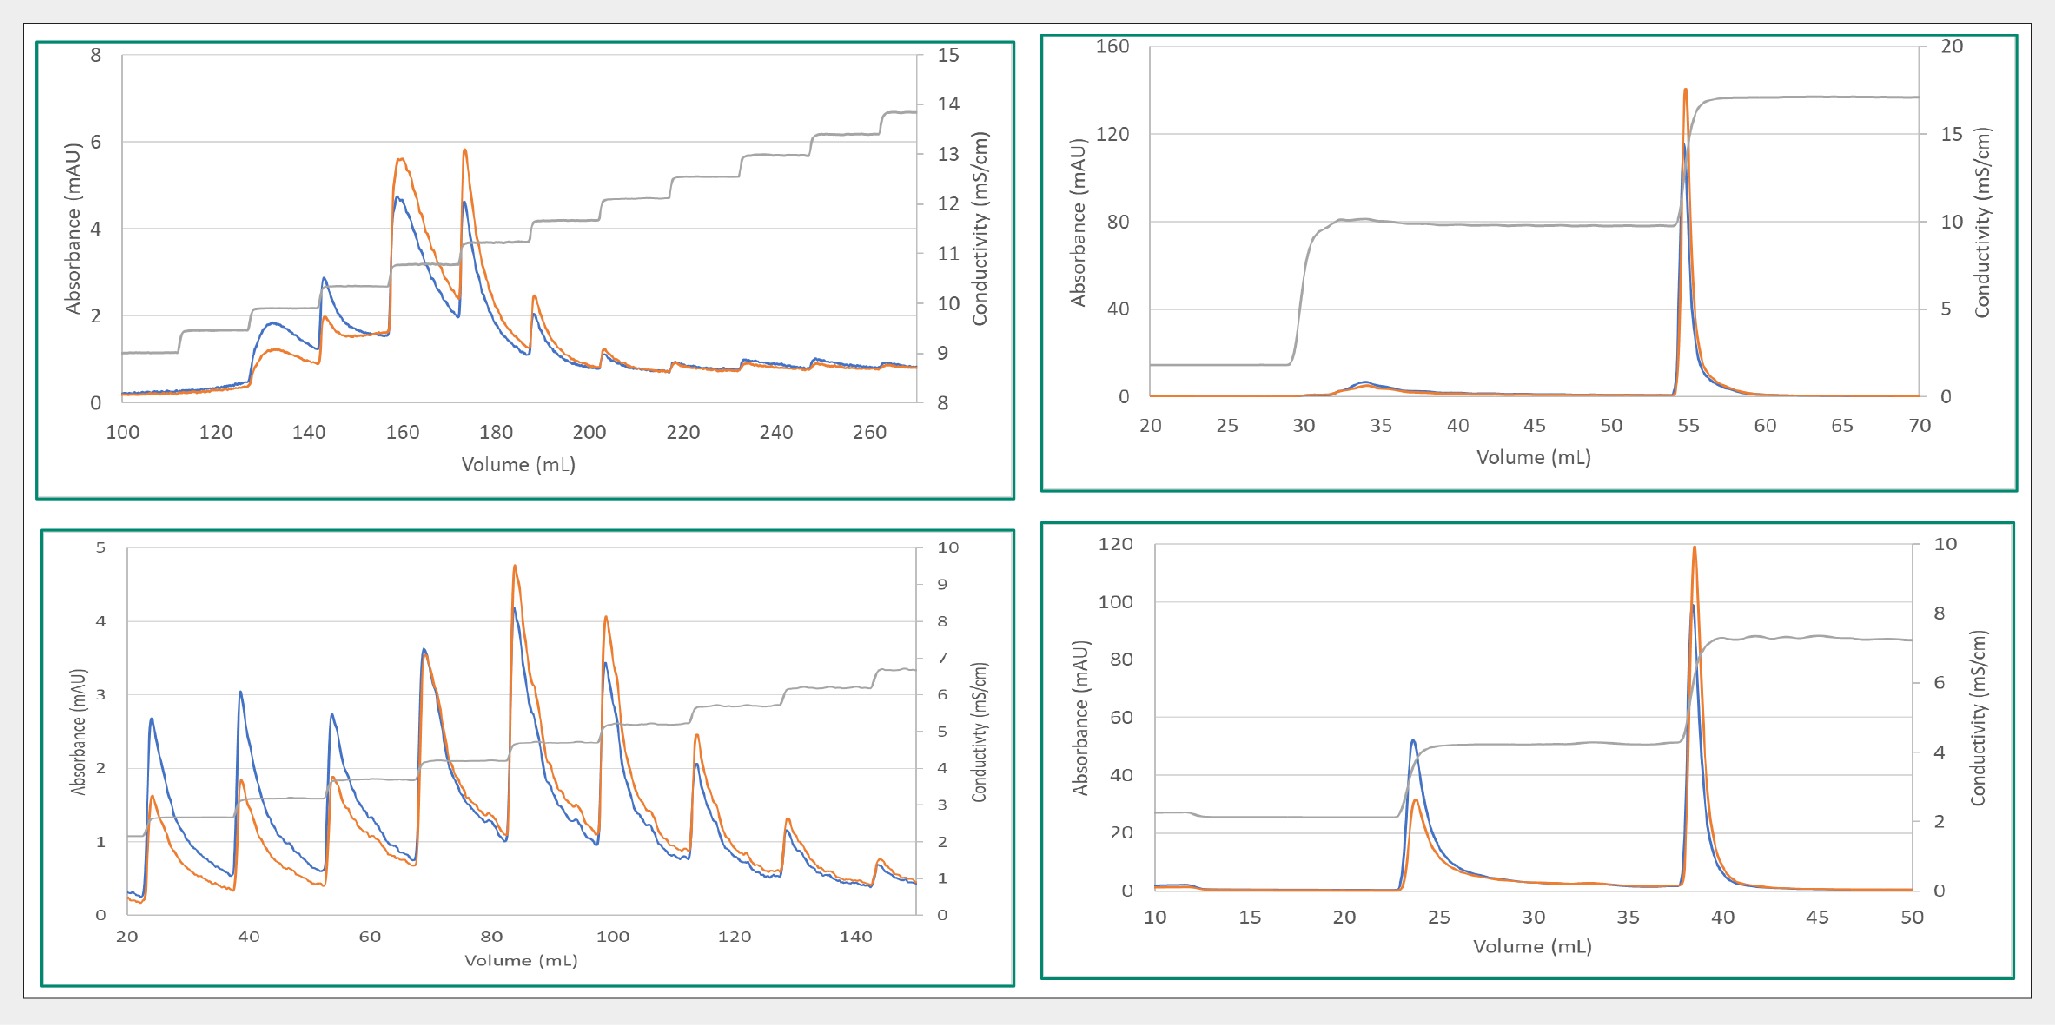 Separation of AAV5 (top left and right) and AAV9 (bottom left and right) with a two-step elution using Mustang Q platform. illustrates that the Mustang Q platform is not confined to AAV8 but can be applied across various serotypes. Similar separation patterns were observed with small conductivity steps, enabling direct translation or further refinement to achieve a two-step elution method.
In the case of AAV5, over 80% full capsids by mass photometry were attained, while with AAV9, approximately 50% full capsids were achieved. A noteworthy insight obtained from this is the correlation between the percentage of full capsids achieved and the starting material composition. While AAV5, commencing at about 40% full, underwent a 2-fold enrichment to reach 80% full, AAV9, starting at only 9% full, experienced over a 5-fold enrichment to attain 48% full.
Capto Q resin: optimizing AAV capsid separation
Capto Q is a resin composed of a rigid, high-flow agarose matrix modified with dextran surface extenders and a strong quaternary ammonium (Q) anion exchanger. Through the evaluation process, various anion exchange resins were examined, including prototypes featuring different ligand densities and extenders. Additionally, numerous conditions and elution protocols were explored, ultimately determining that the existing Capto Q product exhibited superior performance.
Key insights revolve around three ways to enhance this separation. Firstly, by observing the significant impact of dextran extenders, enhanced separation is evident when comparing Capto Q ImpRes without extenders to Capto Q with dextran extenders. Capto Q ImpRes results in a broad single peak that exhibits overlapping elution of full and empty capsids with the front end containing empty capsids (based on the UV260:280 in the chromatogram), whereas Capto Q shows two distinct peaks with a noticeable difference in UV 260:280 ratio, see Figure 4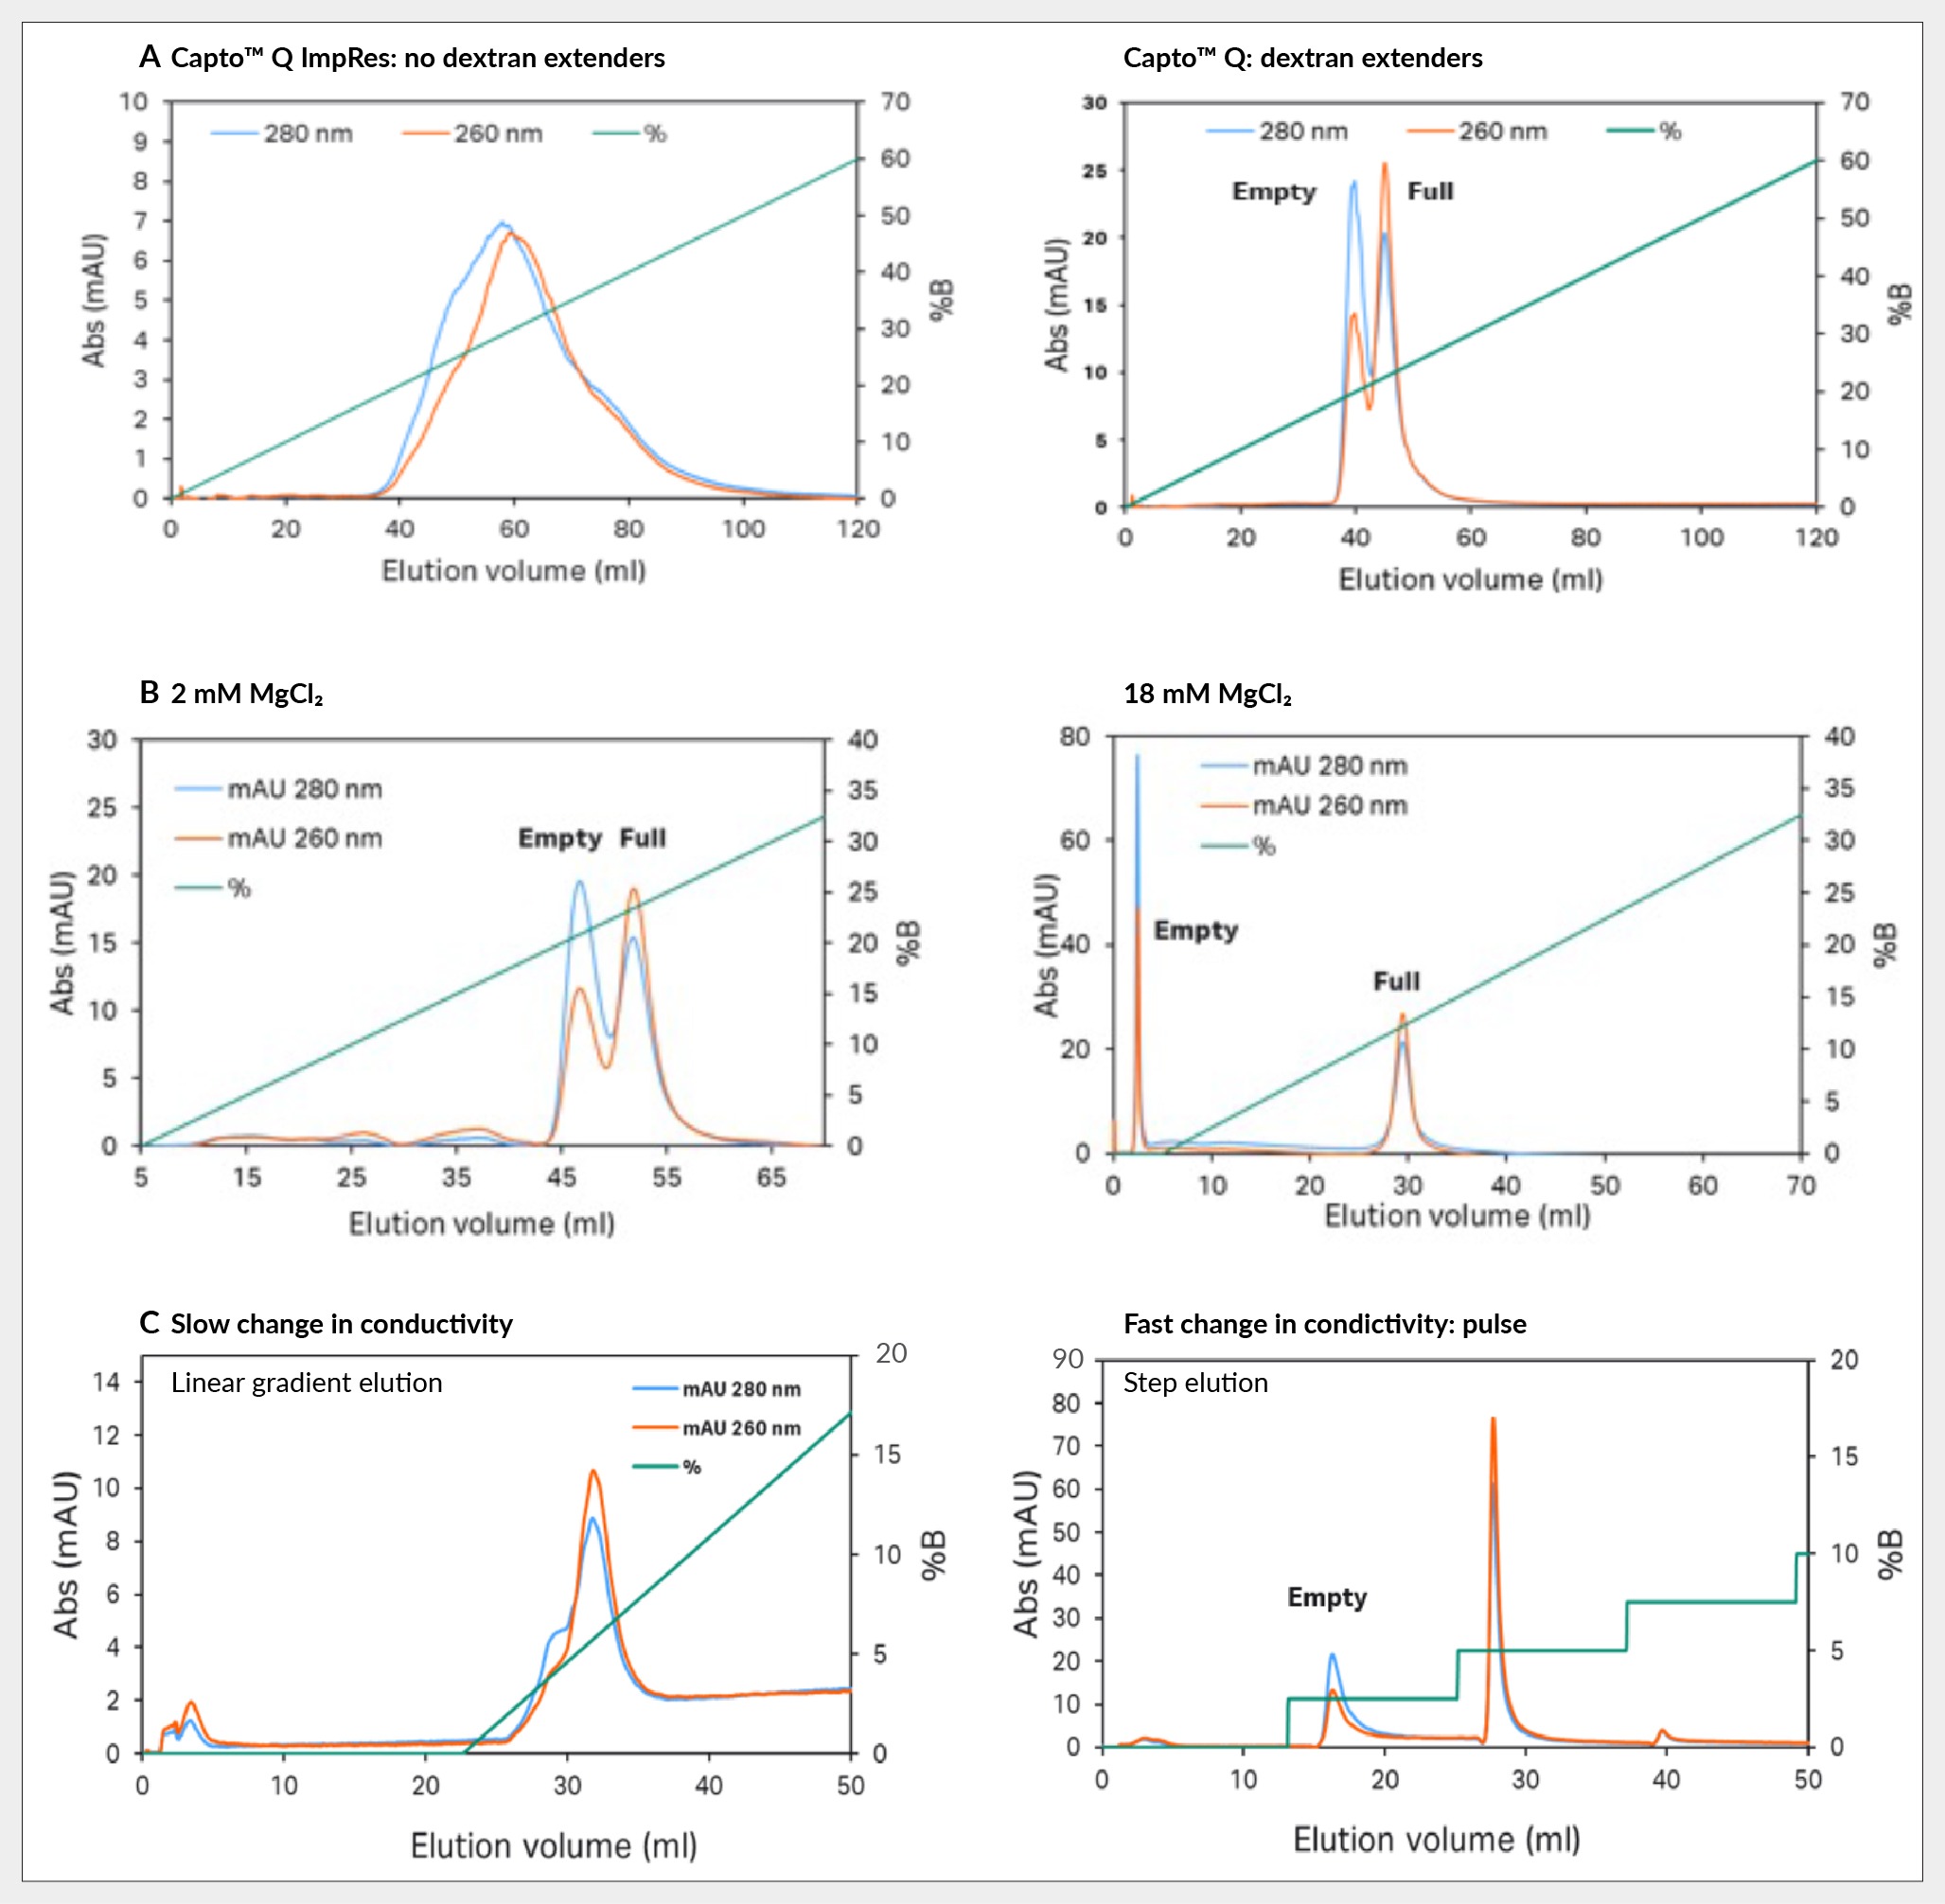 Capsid separation of: (A) Capto Q ImpRes without dextran extenders vs Capto Q with them; (B) Capto Q with 2 mM and 18 mM of magnesium chloride; and (C) Capto Q with slow and fast change in conductivity.A.
Secondly, a constant concentration of magnesium chloride was maintained during the separation process. Magnesium ions are believed to preferentially bind to empty capsids, as evidenced by the pronounced effect observed when increasing the concentration from 2 mM to 18 mM, shown in Figure 4B. At higher concentrations of magnesium chloride, empty capsids elute before the salt gradient application and the full capsids in the gradient, resulting in a baseline separation.
Lastly, sharp conductivity elution steps were employed during the separation process as opposed to linear gradient elution with gradual conductivity changes. For more challenging to purify serotypes, like AAV5, gradient elution often leads to suboptimal separation, characterized by an empty capsid shoulder on the peak, which is highlighted in Figure 4C. In contrast, employing step elution yields two well-separated peaks, enhancing the efficacy of the separation process.
The protocol for the AAV capsid separation with Capto Q appears to be platformable across serotypes to give robust full capsid enrichment with a single set of buffer conditions. However, the protocol is specifically tailored to accommodate AAV9, a serotype known for its weaker binding to the anion exchange compared to other serotypes. Consequently, a lower concentration of magnesium chloride was employed to facilitate AAV9 binding. Additionally, the use of sodium acetate, a kosmotropic (softer) salt, proved beneficial for elution, enhancing the overall outcome.
This protocol yielded positive results across various serotypes, highlighting its versatility. Therefore, there is a strong recommendation for its adoption to streamline operations by utilizing the same A and B buffers across different serotypes. The recommended buffer consists of 20 mM bis-tris propane, pH 9, supplemented with a constant 2 mM magnesium chloride, while elution employs 250 mM sodium acetate.
To determine the percentage of buffer B necessary to remove empty capsids, a prescreening process like that employed for Mustang Q was conducted, involving small conductivity steps of 1 mS/cm. The selection criterion was based on observing changes in the UV 260:280 nm ratio, with the chosen percentage representing the first step in the final two-step protocol for elution of the empty capsids. For instance, AAV9, known for its weak binding, required only 5% buffer B for elution, whereas AAV2, exhibiting the strongest binding, necessitated 40% buffer B (see Figure 5 and final two-step elution (bottom panels). Assessing optimal conductivity for removing the empty capsids is achieved by elution with small incremental conductivity steps (approximately 1 mS/cm or 5% B buffer). Based on the changes of the UV260:UV280 ratio in the individual peaks, selection of conductivity corresponding to the step before increase in UV260:280 ratio is observed (at ratio of approximately 1). The selected conductivity or % B buffer are indicated by the dotted lines and used in the final two-step protocol (seen to the right).") Capto Q chromatography for serotypes AAV2, AAV5, AAV8, and AAV9.Prescreening (top panels) and final two-step elution (bottom panels). Assessing optimal conductivity for removing the empty capsids is achieved by elution with small incremental conductivity steps (approximately 1 mS/cm or 5% B buffer). Based on the changes of the UV260:UV280 ratio in the individual peaks, selection of conductivity corresponding to the step before increase in UV260:280 ratio is observed (at ratio of approximately 1). The selected conductivity or % B buffer are indicated by the dotted lines and used in the final two-step protocol (seen to the right). ).
Capto Q chromatography for serotypes AAV2, AAV5, AAV8, and AAV9.Prescreening (top panels) and final two-step elution (bottom panels). Assessing optimal conductivity for removing the empty capsids is achieved by elution with small incremental conductivity steps (approximately 1 mS/cm or 5% B buffer). Based on the changes of the UV260:UV280 ratio in the individual peaks, selection of conductivity corresponding to the step before increase in UV260:280 ratio is observed (at ratio of approximately 1). The selected conductivity or % B buffer are indicated by the dotted lines and used in the final two-step protocol (seen to the right). ).
The results of the prescreening were implemented into the two-step protocol. Notably, extending step 1 was found to enhance empty capsid removal, through allowing elution of minor tailing of empty capsid and potentially also partial capsids for some serotypes (see Figure 6 shows analysis results from AUC and the table denotes the peak analysis percentage of full capsids from qPCR, ELISA, and AUC. Data courtesy of Beckman Coulter Life Sciences.") Bar diagram of full capsids (green), empty capsids (blue), and partially filled capsids (orange) following two-step elution of AAV5, AAV8, and AAV9 using Capto Q resin.The bar graph (left) shows analysis results from AUC and the table denotes the peak analysis percentage of full capsids from qPCR, ELISA, and AUC. Data courtesy of Beckman Coulter Life Sciences., remains to be investigated further). Subsequently, increasing conductivity during step 2 eluted the full capsids, thereby enhancing purity.
Bar diagram of full capsids (green), empty capsids (blue), and partially filled capsids (orange) following two-step elution of AAV5, AAV8, and AAV9 using Capto Q resin.The bar graph (left) shows analysis results from AUC and the table denotes the peak analysis percentage of full capsids from qPCR, ELISA, and AUC. Data courtesy of Beckman Coulter Life Sciences., remains to be investigated further). Subsequently, increasing conductivity during step 2 eluted the full capsids, thereby enhancing purity.
Consistent buffers were employed across all tested serotypes (AAV2, AAV5, AAV8, and AAV9), with variations in the percentage of buffer B for step 1. The chromatograms presented illustrate prescreening and selection of optimal empty capsid elution and typical UV 260:280 ratios observed for peaks 1 and 2, as seen in Figure 5.
To validate the separation and enrichment of full capsids, peak analysis was conducted utilizing qPCR, ELISA, and AUC methodologies. The findings demonstrated robust enrichment of full capsids, with both qPCR and ELISA assays consistently indicating high purity levels ranging from 95%–100%, known to have lower accuracy due to assay variability that is enhanced when the ratio between them is used. However, given its higher precision, AUC analysis was deemed more dependable, as seen in Figure 6.
AUC analysis of peak 2 revealed approximately 75% purity of full capsids for both AAV5 and AAV8, whereas AAV9 exhibited an even higher purity level of around 88%. Notably, for AAV5 and AAV9, while the proportions were slightly reduced, viral genome yields, as determined by qPCR, consistently exceeded 80%.
GoSilico™ Chromatography Modeling Software process optimization and robustness
As an alternative or a complement to experimental design, in silico modeling tools offer a valuable resource. One such software, GoSilico chromatography modeling software, aids in process development by generating virtual chromatograms based on physiochemical principles. Utilizing data from columns, systems, and select experimental runs, it constructs a calibrated mechanistic model, enabling the simulation of separations and prediction of behavior under various parameters.
Figure 7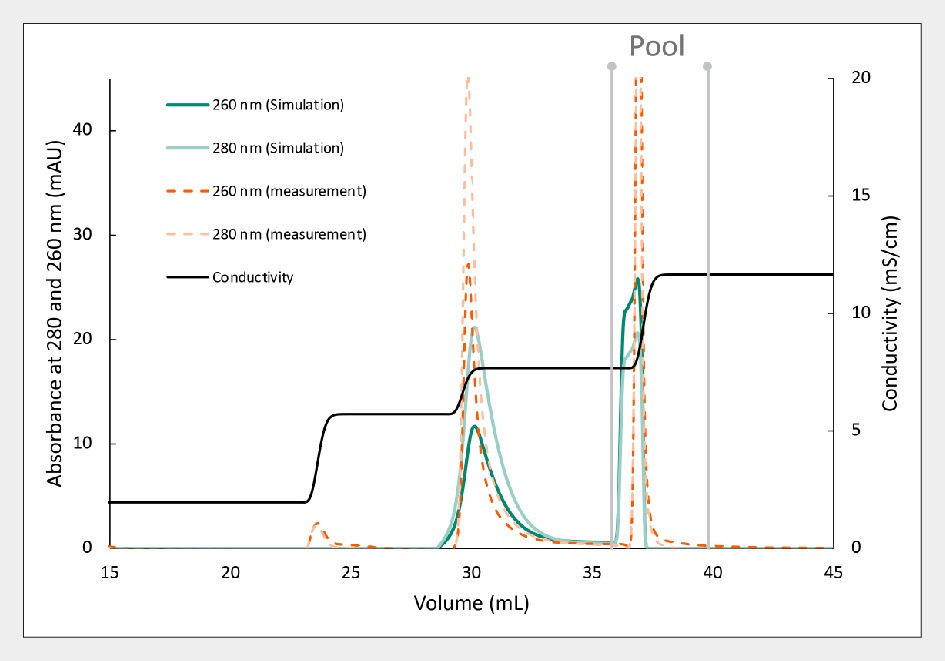 Separation of AAV5 using Capto Q resin, comparing experimental (orange) and separation predicted by in silico modeling (green). demonstrates the effectiveness of in silico modeling for predicting the separation of AAV5. The predicted separation, depicted in green, closely aligns with experimental results, highlighted in orange. Notably, the UV 260:280 ratio for empty and full peaks exhibits striking similarity between predicted and measured values. In this instance, the predicted viral genome yield was 69%, with a projected purity of full capsids at 96%. Such modeling enhances optimization efforts and augments process understanding, fostering efficient and predictable process development.
Furthermore, mechanistic modeling was employed to predict the robustness of yield and purity across varying percentages of buffer B and concentrations of magnesium chloride. Figure 8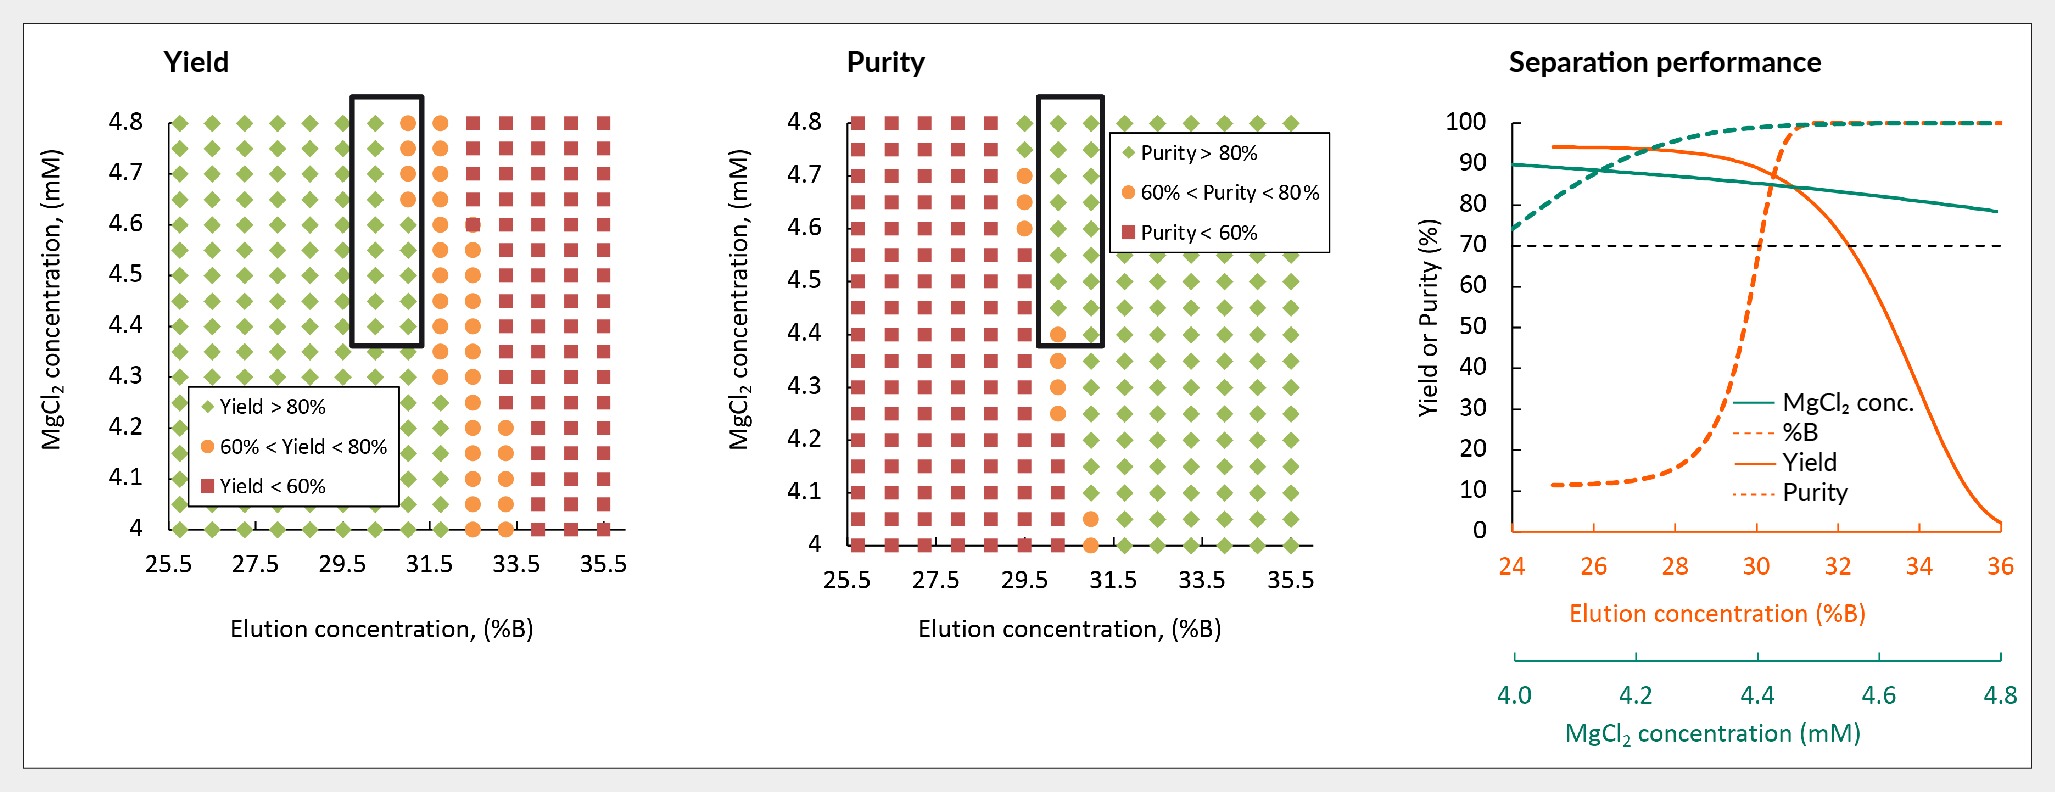 Robustness of yield and purity of in silico separation of AAV5 using Capto Q. illustrates this relationship, with green dots representing conditions where yield and purity exceed 80%, orange indicating values between 60–80%, and red signifying values below 60%.
Further, the graph in Figure 8 shows the balance between yield and purity as buffer B percentage and magnesium chloride concentration are adjusted. Setting a criterion of above 70% for both yield and purity, it becomes evident that achieving such performance requires employing 30%–33% buffer B and maintaining magnesium chloride levels above 4 mM. Mechanistic modeling offers insights into the trade-off between purity and yield, elucidating potential failure points and guiding optimization efforts.
Conclusion
To conclude, the findings emphasize the importance of capsid prescreening using 0.5 to 1 mS/cm steps to identify the conductivity necessary for removing empty capsids. Both DoE and in silico modeling are potent tools for optimizing separation and understanding the operational parameters for each serotype or capsid variant.
The Mustang Q membrane facilitates rapid separation, while the Capto Q resin enhances separation, particularly due to the presence of dextran extenders on this resin. Critical tips to avoid common pitfalls include utilizing a 10-mm UV detector for sensitivity, bypassing the mixer in small-scale setups to reduce dead volume, and ensuring a conductivity of about 2 to 3 mS/cm in the load material by dilution in buffer A.
Further, prescreening for new capsids and increasing the constant magnesium chloride concentration can enhance separation efficiency. It is essential to note that high pH may precipitate magnesium chloride, so pH of buffers should be adjusted prior to adding it.
Adjusting the length of step 1 or allowing empty capsids to flow through can improve the purity of peak 2. Ultimately, both Mustang Q membrane and Capto Q resin offer scalable, full capsid enrichment for AAV2, 5, 8, and 9, and likely other serotypes and capsid variants with proper optimization.
Q&A

There is good fold enrichment of full capsid with AEX, but what would happen if you reload? Would you see more enrichment?
MS: This has been attempted with Mustang Q where initially, we were disappointed to not get more fold enrichment and to see even higher percent full capsids with a second round of chromatography. Thinking about that more, we are reassured by the result in the end, as the empties are not having an impact on where the full are eluting. That talks to the robustness of the purification, but whenever we do that reload, we do not get more percent full.
AHM: Reloading has not been attempted with the Capto Q as we saw good enrichment from the start. There have been some collaborators trying it; however, they have not been successful as they are seeing similar results to Mustang Q. If you are below 10% of full capsids in the sample, then it is best to avoid using this type of material. You can get better results if you are at least over 10%, but preferably over 20%. It is better to put effort into optimizing the upstream to get a high percent full from the start.
When adjusting the feed to pH 9 and low conductivity, do you incorporate magnesium chloride? Additionally, in the preceding wash step, how does magnesium chloride contribute to enhancing the empty-full capsid separation?
AHM: Through rigorous screening and testing, we have found that magnesium, with its divalent cation properties, showed to be critical for optimal separation results. There is a notable interaction between magnesium chloride and capsids, particularly with empty capsids. Increasing the magnesium chloride facilitates the separation by increasing the charge difference giving earlier elution of empty capsids, also resulting in the elution of full capsids at lower conductivity levels. This differential interaction plays a pivotal role in enhancing the separation process, although the precise mechanisms behind it remain unclear.
What is the difference in flow rates between membrane and resin? How much faster is it when employing membrane?
AHM: The flow rates between membrane and resin are quite significant, typically ranging from 5–10 times faster with membranes. However, this speed variance can also be influenced by the scale of operation. Also, factors such as capacity differences and serotype-specific considerations should be considered when deciding between alternatives. For instance, certain serotypes or capsid variants may exhibit higher yield and purity with one method over the other.
MS: Looking at resin chromatography, Capto Q resin can potentially run one column volume per minute as opposed to Mustang Q membrane that could achieve flow rates of up to 10 membrane volumes per minute. This acceleration would then require necessary adjustments such as potentially requiring more buffer for the membrane method, thereby halving, or even quartering the processing time.
Biography
Åsa Hagner-McWhirter has been with Cytiva, Uppsala, Sweden since 2003 and is a viral vector downstream and analytics SME and analytics subject matter expert. Åsa holds a PhD in Medical Biochemistry from Uppsala University, Uppsala, Sweden in 1999 based on research around biosynthesis of proteoglycans. The studies involved polysaccharide structure analysis, enzyme purification, and cloning as well as characterizing an enzyme reaction.
Mark Schofield earned his degrees in Scotland, a BSc from the University of Edinburgh, Edinburgh, UK and a molecular biology PhD from the University of Dundee, Dundee, UK. For the last 12 years he has been at Cytiva focusing on chromatography applications. Currently his team works on bioprocess intensification solutions and chromatographic separations for gene therapy modalities.
Affiliations
Åsa Hagner-McWhirter PhD
Principal Scientist,
Cytiva,
Uppsala, Sweden
Mark Schofield PhD
Senior R&D Manager,
Cytiva,
Westborough, MA, USA

Authorship & Conflict of Interest
Disclaimer: ÄKTA, Capto, ELEVECTA, GoSilico, and Mustang are trademarks of Global Life Sciences Solutions USA LLC or an affiliate doing business as Cytiva. Any other third-party trademarks are the property of their respective owners.
Contributions: The named authors take responsibility for the integrity of the work as a whole, and have given their approval for this version to be published.
Acknowledgements: The authors would like to acknowledge the Cytiva R&D team, including GoSilico team in Uppsala, the Cytiva R&D team in Westborough and the team at Beckman Coulter Life Sciences for their collaboration.
Disclosure and potential conflicts of interest: Dr Hagner-McWhirter has collaborated with Beckman Coulter Life Sciences and Affinia Therapeutics. Dr Schofield holds Danaher stock.
Funding declaration: The author received no financial support for the research, authorship and/or publication of this article.
Article & Copyright Information
Copyright: Published by Cell & Gene Therapy Insights under Creative Commons License Deed CC BY NC ND 4.0 which allows anyone to copy, distribute, and transmit the article provided it is properly attributed in the manner specified below. No commercial use without permission.
Attribution: Copyright © 2024 Cytiva. Published by Cell & Gene Therapy Insights under Creative Commons License Deed CC BY NC ND 4.0.
Article source: Invited. This article was based on a webinar, which can be found here.
Webinar conducted: Apr 2, 2024; Revised manuscript received: May 30, 2024; Publication date: Jun 24, 2024.